Wind Scam Turning Germany into an Energy Poverty Country!

Germany’s Wind Power Chaos to Leave them Freezing in the Dark

transformer

****

The Germans are rueing the day the bought into the great wind power fraud.

The Germans went into wind power harder and faster than anyone else – and the cost of doing so is catching up with a vengeance. The subsidies have been colossal, the impacts on the electricity market chaotic and – contrary to the environmental purpose of the policy – CO2 emissions are rising fast: if “saving” the planet is – as we are repeatedly told – all about reducing man-made emissions of an odourless, colourless, naturally occurring trace gas, essential for all life on earth – then German energy/environmental policy has manifestly failed (see our post here).

Some 800,000 German homes have been disconnected from the grid – victims of what is euphemistically called “fuel poverty”. In response, Germans have picked up their axes and have headed to their forests in order to improve their sense of energy security – although foresters apparently take the view that this self-help measure is nothing more than blatant timber theft (see our post here).

German manufacturers – and other energy intensive industries – faced with escalating power bills are packing up and heading to the USA – where power prices are 1/3 of Germany’s (see our posts here and hereand here). And the “green” dream of creating thousands of jobs in the wind industry has turned out to be just that: a dream (see our post here).

The ‘gloss’ has well and truly worn off Germany’s wind power ‘Supermodel’ status – as communities fight back against having thousands of these things speared into their backyards – and for all the same reasons communities are fighting back all over the world; those with a head for numbers have called the fraud for what it is; and medicos have called for a complete moratorium on the construction of new wind farms in an effort to protect their patients and quarantine their professional liability:

Germany’s Wind Power ‘Dream’ Becomes a Living Nightmare

German Medicos Demand Moratorium on New Wind Farms

And, on a practical level, those in charge of Germany’s power grid have stepped up calls for an end to the lunacy of trying to absorb a wholly weather dependent generation source into what was never designed to deal with the chaos presented on a daily basis:

Germany’s Wind Power Debacle Escalates: Nation’s Grid on the Brink of Collapse

Electricity grids were designed as – funnily enough – ‘SYSTEMS’ – that can only operate around tolerances of a few volts and hertz, either way. Their designers never had the chaos of wind power generation in mind – with 60% of its installed capacity being thrown at the grid for a few hours when the wind blows and – without meaningful warning – having the whole lot disappear in a heartbeat.

13 June SA

[Now, that’s what STT means by ‘disappearing in a heartbeat’. Entire South Australian Grid – 13 June 2015 – from 9am to 3pm – a collapse of 750MW – 800MW to 50MW – or an output drop of 94% – at a rate of 125MW/hour]

That kind of chaos is set to have calamitous consequences for the entire grid – and every living thing connected to it. Here’s NoTricksZone with a no-punches-pulled take on Germany’s unscheduled return to the very Dark Ages.

“Alarming Results” From Fraunhofer Institute Study On Grid Overloading From Wind, Solar Power … Crippled Cities
Pierre Gosselin
NoTricksZone
15 July 2015

As Germany piles on more sporadic energy from wind and solar into its power grid, stability concerns are growing.

Increasingly volatile energies like wind and sun are turning out to be more of an expensive nuisance rather than a benefit.

Researchers at the Germany-based Fraunhofer-Instituts für Optronik, Systemtechnik und Bildauswertung, Institutsteil Angewandte Systemtechnik (IOSB-AST) have studied the risk of grid overloads caused by renewable energies at the community level, the online Ostthüringer Zeitung (OTZ) writes here.

The result, reports the OTZ:

Already in just a few years power will have to be stored locally as well. […] And the answers in their study are, depending on the perspective, thoroughly alarming or spurring for policymaking and the economy.

According to the OTZ, a team of researchers led by Peter Bretschneider at the Fraunhofer’s IOSB-AST conducted a 3-year study, where they literally built a statistical mock-up city of 30,000 that included a downtown, residential areas, commercial district, solar installations and wind parks. “A total of 1847 residential and business buildings that included everything from grandma’s little house to office complex for public officials.”

And so that the mock-up city simulates what is typical today in Germany, it also had everything a town would expect to have with the current German feed-in act:

4456 ‘grid elements’, i.e. power lines, transformers, large points of consumption and feed-in systems, foremost photovoltaics on the roofs.”

Even the homes were provided with the thermal insulation that they are expected to have later on.

The OTZ continues:

Next the Fraunhofer scientists electrified their simulated city. Then using meteorological data they allowed the sun to rise and set, the wind to blow, the temperatures to change – just like in real life.”

Next they extrapolated outwards to the expected conditions of the year 2018 and 2023, leaving the local power grid unchanged and allowing more wind and solar energy to come online as expected from the provisions of the feed-in act. How did the city’s power grid fare? The OTZ tells us the shocking results, and they aren’t pretty:

Already today in the simulated city one of the 14 network nodes gets sporadically overloaded. In 2018 the impacted transformer comes under serious stress 22 days a year, and so does another transformer. Five years later three nodes are impacted by long-term frequent back-feeding of surplus solar energy in the medium-voltage grid. At least one cable in the area exceeds ‘the limits of thermal loading’. […]  ‘Yes, a transformer would be glowing – and the cable would go up in smoke,’ system engineer Sebastian Flemming explains the results in layman’s terms.

The OTZ asks what this all means for the citizens? Flemming responds: “Blackout, for the entire city.”

In the wintertime this would be most inconvenient, and for some possibly even fatal.

Flemming adds that even if a blackout were averted, the wild frequency fluctuations in the grid would have “grave consequences” for many electrical appliances and systems. The OTZ writes:

None of today’s productions systems in the economy could function under such fluctuations, especially everything that is computer-controlled.

In other words, it would not even take a blackout to cripple a city.

The OTZ then asks what can be done with the surplus electrical energy that will surely result from the wind and sun. Here once again the financially and technically unfeasible storage systems get brought up. Another solution mentioned is the conversion of the electricity into heat for supplying warmth to homes.

But the online OTZ daily writes that solutions appear to be a ways off, and so it warns:

Time is running out: According to the study, beginning in 2018, the first transformers are threatened with prolonged overloading.”

Do these findings of the Fraunhofer Institute surprise us? Not at all. It’s been known for a long time that the feed-in of solar and wind power leads to crazy, uncontrolled power surges in the grid. Supply stability remains the glaring problem that too many among us continue to deny.

Prepare for blackouts!
NoTricksZone

studying candle

Storing Wind Energy is another Unaffordable Scam…

The Patent Nonsense of ‘Storing’ Wind Power Smashed

giant battery 2

****

The wind industry is the perpetual infant of power generation: always looking for the subsidies to last that little bit longer; always promising to improve its performance; always claiming it will outdo hydro, coal and gas – provided, of course, that the subsidies keep flowing. STT for one thinks the wind industry has had ample time to grow up and stand on its own two feet.

Like the brat that it is, the wind industry can’t be told what to do and, especially, won’t ever respond to demands from power users about when its product should be delivered.

output vs demand

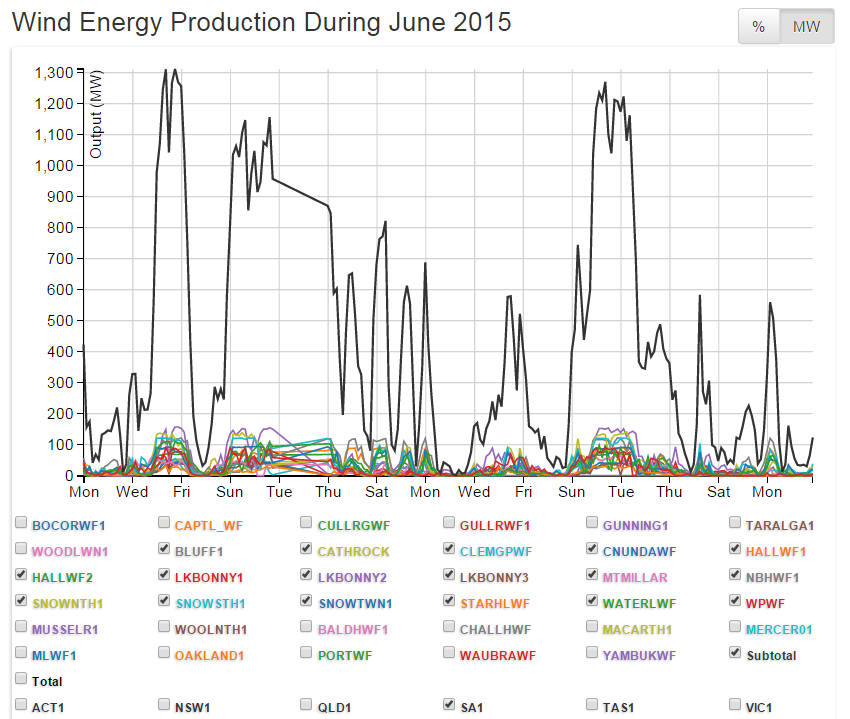
It’s quite happy to produce plenty of power when it’s not needed at night time; and much less during the day, when it is (as seen in the graph above); and often, none at all during periods of peak demand: as seen in our posts from earlier this week:

The Wind Power Fraud (in pictures): Part 1 – the South Australian Wind Farm Fiasco

The Wind Power Fraud (in pictures): Part 2 – The Whole Eastern Grid Debacle

When challenged about its consistent failures to match output with demand, the wind industry and its parasites respond by mumbling about “battery technology improving”.

The pitch is that – one day “soon” – there will batteries big enough and cheap enough to allow huge volumes of wind power produced when it’s not needed, to be stored for the occasions when it is. That way, the “variable” output from wind farms could be delivered when there might just be a market for it.

Of course, the pitch is made so the subsidies keep flowing to allow an endless sea of giant fans to be erected now – in order to take advantage of the (so far, elusive) storage technology that’s just over the “horizon”. Except that the “soon” is more like light-years and the “horizon” is a mirage.

Even if a technology was invented (STT likens it to the chances of finding a perpetual motion machine or alchemy turning lead into gold) to store large volumes of the electricity output (in bulk) from all of the wind farms connected to the Eastern Grid, say (which now have a notional capacity of 3,669 MW) – the economic cost would be astronomical – and readily eclipse the value of the power produced. Not that the wind industry has ever made any economic sense. We visited the topic a while ago:

The Economic Storage of Wind Power is a Pipe-Dream

And, with the wind industry’s PR spinners becoming more desperate and silly by the day – in a ‘we love kicking a mangy dog when it’s down’ kind of way, we thought it high time to revisit – and launch a final assault on – the greentards’ last redoubt.

Their pitch is that cost effective, ‘grid scale’ electricity storage will overcome the chaotic and occasional delivery of wind power, to have it stand shoulder-to-shoulder with the ‘big boys’ – coal, gas, hydro and nuclear.

The following article details the INSANE cost of attempting to store electricity in bulk quantities. In just one example, the paper explains how with the “simple” addition of a US$14.4 million, 16.8 MWh Lithium-Ion battery, the crazy, intermittent output of a 30% capacity factor, US$3.5 million, 2MW wind turbine can be turned into a constant 0.6MW output (2MW x 30%) combination – for trifling US$18 million. That works out to a staggering US$30 million per MW of wanna-be “base load” power – with its major component (the battery) having a useful life of around 10 years.

As it will never amount to a meaningful power source, wind power is simply an energy and economic nonsense. The fact that the electricity it produces (usually, when no-one needs it) can’t be stored, dooms wind power to the Dark Ages – from whence it came.

Intermittent grid storage
Climate Etc
Rud Istvan
1 July 2015

From the utility grid perspective, a fundamental problem with wind and solar is intermittency.

In the US, wind has a median capacity factor of 31%. In California’s Mohave Desert, solar PV has a capacity factor of 23%. To make up the electricity supply difference during the rest of the time, grids must either add otherwise unnecessary backup generation, or flex base load generation (dropping below optimum output so the grid can accept the intermittent renewable input). At a minimum, flexing results in costly capital inefficiency. Otherwise unnecessary backup generation is even more costly.

The higher the renewable penetration, the greater this intermittency burden becomes. For Texas’ ERCOT grid with 10.6% wind, the additionalcosts are ~$19/MWh for generation plus ~$6.50/MWh for transmission. It is now so expensive in Germany (26% renewable generation) that its largest utility, RWE, took a €3.3 billion impairment charge 1Q2014. The second largest, E.ON, took a €4.5 billion impairment charge 4Q2014, and announced it was spinning its conventional generating assets off into anunprofitable separate company. E.ON will also be shutting Irsching 4 and 5, large efficient CCGT units completed in 2010 and 2011! Irsching simply is not viable without being compensated for the forced Energiewende flexing it endures, while selling its electricity against the subsidized renewables with which it is also forced to compete.

So renewables advocates hope for major advances in grid storage to offset wind and solar intermittency. This guest post surveys what might be possible in the future given what is presently known. The focus is on utility scale, but takes an irresistible detour through TESLA’s newly hyped residential Powerwall. Sandia has a more detailed (albeit somewhat dated and hopefully slanted) utility storage analysis than this post, for CE denizens interested in digging deeper.

There are in principle only five ways that generated electricity can be subsequently ‘stored’: potential energy (e.g. pumped hydro), kinetic energy (e.g. flywheels), electrostatic energy (capacitors), electrochemical energy (batteries), and chemical energy (e.g. water hydrolysis). Anyone inventing another is in line for an automatic Nobel Prize (probably two, physics or chemistry plus peace).

Pumped hydro storage (PHS)

Potential energy in the form of pumped hydro storage (PHS, essentially reversible hydroelectricity) is >99% of existing grid storage worldwide.The figure is from EPRI 2011. EPRI has not updated their overall grid storage analysis, but did estimate that ~140,000MW of PHS was installed by YE2014.

400-1

All that a grid needs are upper and lower water ‘reservoirs’ in ‘hilly’ terrain, and reversible hydroturbogenerators. It is possible to excavate a lower reservoir deep underground, but at much higher cost. One such facility is proposed for Holland. O-PEC would be 1400MW x 6 hours for €1.8 billion, using a 1400m (!) hydrostatic head to minimize water and underground chamber volume.

400-2

Round trip efficiency is high at over 80%, and facility life is long at much over 40 years. The LCOE depends on facility size, cost, and hydrostatic head, ranging from as low as ~$85/MWh (EIA) to as high as ~$150 to $200/MWh (Sandia). PHS has so far been used mainly for peak load shifting. Off peak base load is used to pump water into the upper reservoir, which then generates back into the lower during peak load. This allows a larger grid proportion of low cost base load generating at optimal output 24/7 than would otherwise be possible. Where grid/terrain possible, PHS can also support renewable intermittency as already done somewhat in southern Germany, Austria and Switzerland (the Alps).

PHS always pays on a grid system basis if suitable affordable terrain is available. Many places favorable for wind (low relief Iowa, Denmark, northern Germany) or solar (low relief Mohave Desert) are distinctly NOT favorable—even though PHS does not have to be co-located, just very strongly grid intertied.

Developed world grids have already taken most of the advantage they can of PHS. California is an odd exception.

Kinetic Energy Storage

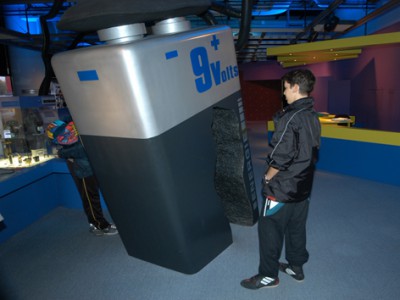
Kinetic energy storage is also extensively used on the grid, in the form of synchronous condensers for reactive power compensation (aka volt ampreactive, VAR). These are essentially unpowered generators spinning on grid. Some old decommissioned coal generating plants repurpose the old generators as ‘new’ synchronous condensers. Rotors may weigh hundreds of tons and spin at up to 3600 rpm, but still only store enough kinetic energy to provide transient voltage/frequency regulation (VAR). Downtown Tokyo alone uses six Toshiba purpose built 200MVARs. The human figure illustrates the enormous size/mass of grid scale kinetic storage machines. They are still grossly insufficient for bulk intermittent renewable storage.

400-3
Beacon Power enhanced kinetic energy density by using grid-coupled carbon fiber flywheels spinning at 16000 rpm (reaching Mach 2, requiring they spin in a vacuum). Beacon’s first (subsidized) 20MW x 0.25hour facility comprised 200 flywheels and cost $4800/MWh. Its purpose was frequency regulation (VAR), not bulk energy storage. This facility is the flywheel capacity in this post’s initial EPRI energy storage figure.

400-4

That is far too little energy for bulk utility wind or solar intermittency. To back up a single 2MW wind turbine at 30% capacity factor would require ([1-0.3]*24 hours / 20MW/ 2MW * 0.25hour) 6.7 of the pictured facilities.

Electrostatic storage

Electrostatic storage in capacitors is ubiquitous. There are large capacitor banks for reactive power compensation (VAR) on all utility grids.

400-5
Super capacitors have the highest energy density of any capacitor type, an order of magnitude more than the next best kind. Supercaps plus power electronics have created a rapidly growing new utility device class in the past decade, static compensators (statcoms). These substitute for smaller synchronous condensers; ABB’s statcoms come in sizes up to 30MVAR. Their advantage is no moving parts/maintenance. Like synchronous condensors and capacitors, statcoms store far too little energy for bulk wind and solar needs.

Electrochemical batteries

Electrochemical batteries presently have limited use on the grid. Rechargeable battery electricity is stored in some reversible electrochemical reaction. Familiar lead acid (PbA) electrochemistry is sponge lead/lead dioxide electrodes creating/removing lead sulfate, with sulfuric acid electrolyte conducting the needed sulfate ions. Which is also why deeply cycled PbA batteries have inherently short cycle life unsuited to utility storage. Cycling grows ever-larger and increasingly insoluble lead sulphate grains (sulfation), while the growing/shrinking lead sulfate in the electrodes eventually causes them to disintegrate from mechanical stress. Xtreme Power designed an industrial/utility PbA capable of 650 cycles to 80% discharge, which would last less than two years supporting solar. Xtreme delivered (to utilities) about 35MW at about $1000/MWh before going bankrupt. Xtreme is the PbA in the initial figure.

There are many reversible electrochemistries. Commercial ones include PbA, Nickel Metal Hydride (NMH, in most hybrid autos), lithium ion (LiIon, ubiquitous in portable electronics and electric vehicles), and sodium sulfur (NaS). There are several ‘experimental’ chemistries with one or more as yet unresolved issues. These include lower cost lead carbon (PbC, cycle life), lower cost and higher energy zinc air (cycle life, safety), lower cost and higher energy sodium ion (cycle life), higher energy lithium air (cycle life, safety), higher energy solid state LiIon (SSLiIon, cost, cycle life), and higher energy lithium sulfur (LiS, cycle life). Furthest along seem to be PbC, SSLiIon, and LiS (the links are illustrative, not exhaustive of all the entities working on these electrochemistries).

There is a lot of uninformed MSM reporting on battery progress, often based on hyped lab PR (most recently Harvard’s rhubarb battery, below). Electrochemistry has been known since Alessandro Volta’s 1799 stack of zinc, brine soaked paper separator, and copper twitched a frog’s leg. Sticking zinc and copper into a lemon still works—but not for any practical application. Many, many $billions have been spent on battery R&D over the past century. Progress remains a very slow slog. It is beyond unlikely that any fundamental electrochemical miracles remain unrevealed.

There are two basic battery design concepts. The familiar one (like PbA, NMH, and LiIon) stores electricity in the electrodes. This is not a problem for portable electronic tiny energy storage needs. It is a big problem for utility bulk storage requiring a lot of expensive electrode. A123 Systems delivered one 20MWh LiIon system (10 of the imaged containers) that cost (based on its federal loan guarantee) $17.1 million. This facility is the LiIon capacity in the initial figure.

400-6

Backing up a single ~$3.5 million 2MW wind turbine at 30% capacity factor would require 8.4 of these containers at a cost of ~$14.4 million. They would be purchased from NEC Energy Solutions; A123 went bankrupt. Its assets were sold to the Chinese at a $119 million loss to US taxpayers who gave A123 grants and loan guarantees. The Chinese sold the utility portion to NEC. NEC has a new order for 3 20MW installations for the PJM grid. Like Beacon’s flywheels, these are for frequency regulation, not bulk renewable energy storage. In that application (which does not deeply discharge the batteries), NEC says they last 20 years—still insufficient for wind or solar without replacement.

If energy density can be increased, then the amount of electrode per unit electricity can be decreased proportionately. LiIon’s theoretical limit is 1015 Wh/liter. The Panasonic cells Tesla uses (below) are about 620 Wh/L (cells, not the Powerwall battery at ~350 Wh/L with liquid cooling). Panasonic produces more advanced (and more expensive, shorter lived) smartphone cells that approach 800 Wh/L. There will undoubtedly be some further improvement in LiIon energy density, but nothing like what has already been achieved.

The main ‘electrode concept’ utility battery is NaS. Several hundred MW are already on grid, as the first figure shows. These operate at 350C (and must be kept at that temperature continuously), have a 15-year life (significantly longer than deeply discharged LiIon at ~10 years per Tesla), and have a round trip efficiency of 75%. They are used in special grid distribution situations, for example to support remote peak loads where a small peaker or a beefed up transmission line would be even more expensive than NaS. California’s PGE just installed a 4MW x 6hour NaS facility from Japan’s NGK. It cost $18 million.   

400-7
At 30% capacity factor, about (16.8 hr *2MW/[4Mw x 6hr = 24MWh NaS] /0.75 efficiency) 1.9 of these facilities would be needed to back up a single2MW wind turbine. NaS would cost $34 million to back up one $3.5 million turbine. And it would have to be replaced after 15 years to support the turbine’s ~25 year life. NaS is not commercially feasible for renewable bulk electricity storage.

The other class of battery design stores electricity in the electrolyte, and only uses smallish expensive electrodes to put it in and take it out as electrolyte is pumped through the electrodes. In such ‘redox flow’ batteries, the electrolyte can be stored in arbitrarily large tanks. This theoretically solves the grid scale electrode cost problem. And also part of the battery cycle life problem, since the electrolyte and/or electrodes can be separately replaced.

There are several redox flow chemistries in development. Some are expensive and corrosive, like the vanadium redox battery (VRB). The most recently hyped experimental system uses inexpensive organic quinones similar to those found in rhubarb. No word yet from Harvard on round trip efficiency, or how long their ‘breakthrough’ rhubarb flow battery might last.

One seemingly promising type (since a commercial unit exists) uses relatively (compared to vanadium) inexpensive iron/chromium, championed by 2008 California startup EnerVault. Their first ‘commercial’ flow battery (250kw x 4hour = 1MWh) was installed in 2014 to support a solar powered 250kw irrigation pump in Turlock, California. It has a round trip efficiency of 60%. To back up a single 2MW wind turbine at 30% capacity factor would require (16.8 hours *2MW/ 1MWh/0.6 efficiency) 56of the pictured EnerVault facilities. Or requires tanks, electrodes, and pumps that are 56x bigger than pictured.

400-8
The facility cost $9.5 million, $4.7 million from a US grant. EnerVault told EPRI and DoE (as part of the grant process) that it expected to be ~$350/kWh in volume production. Backing up a single $3.5million 2MW turbine might cost ‘only’ $12 million in the future. The useful lifetime is TBD; EnerVault says >20 years. But EnerVault also says the pumps last “thousands of hours” before needing replacement. That could mean yearly—and probably does. On April 14, 2015 EnerVault announced it was ‘restructuring’ (laying off most employees) and ‘seeking new owners’. Existing investors including Japan’s Mitsui, French oil company TOTAL, and 3M declined to put in more money. EnerVault has failed.

The foregoing examples illustrate the immensity of the utility bulk storage challenge. No foreseeable battery solution overcomes this enormous challenge.

Distributed grid storage

There has been much renewables discussion of ‘distributed’ grid storage. Put many smaller batteries at residential or commercial locations, in the hope that manufacturing volumes would provide cost economies of scale. Thus the MSM excitement Elon Musk created with his Tesla Gigafactoryand the Powerwall. The 7kWh daily cycle unit (complementing rooftop PV) has a guaranteed 10 year life at 92% round trip efficiency for $3000, excluding installation and inverter.

Whether Powerwall makes any sense is a less exciting question, which Musk’s fawning MSM did not ask. Palo Alto’s approximate LCOE for rooftop PV is ~$0.155/kWh for a 5kWDC system before subsidies, according to Palo Alto itself. To charge a single Powerwall while still using the original PV as before, about (7kWh/5.4 ‘sun hours’ per NREL /0.92 efficiency) 1.4 kW of additional PV would have to be installed. Using Palo Alto’s ‘official’ estimate, that is an additional PV cost of about $8400 (including the inverter Tesla does not supply). Total cost $11,400 for one Powerwall is no problem—if you can afford to live in Palo Alto and install PV there in the first place. The city says its average home consumes about 1000 kWh/month or (1000/~30.5) 32.8kWh/day. A 6.4kW PV plus one Powerwall will not take an average Palo Alto home off grid—it is (32.8-12) 20.8kWh short. It would take 4 Powerwalls (plus their additional PV) to go off grid. Not enough dollars or roof to make that work.

Being a little bit Palo Alto/Tesla green comes at a large cost. The 10-year, 0.065 discount rate LCOE of single Powerwall is $0.118/kWh. To that must be added the LCOE of the extra charging PV, adjusted for Powerwall efficiency. According to Palo Alto, that is (~0.155/0.92) $0.168/kWh, for total Powerwall LCOE of $0.286/kWh. The residential cost of electricity in California (March 2015) averaged ~$0.17/kWh. Powerwall is a bad deal, costing almost twice what California’s residential grid electricity does. (Tesla cars are a similarly bad deal.)

Chemical storage

Chemical energy storage involves electricity reversibly converted into simple chemical energy (some fuel). Two chemistries have been seriously proposed: hydrogen and methane.

Hydrogen

Hydrogen can certainly be hydrolyzed from water. And the necessary electricity can certainly come from intermittent renewables. The most efficient way to convert hydrogen back to electricity at grid scale would be a PEM fuel cell or an SOFC. The math can be done using Ballard’s 1MW PEM, since a few have actually been sold as demos. Ignore the technical difficulties of bulk hydrogen storage, which the following methane alternative ‘solves’.

The theoretical efficiency of hydrolysis is ~88%. About 4% of commercial hydrogen is made this way today, with real efficiencies of ~75%. EERE says PEM fuel cells can be 60% efficient. But that is also theoretical. Ballard’sreal 1 MW ClearGen® is 40±2% efficient, with a lifetime of ~15 years (similar to NaS). The round trip efficiency of a hydrogen electricity storage system would be about (0.75 * 0.4) 30%. For a utility, that is awful.

The electricity to be stored comes mainly from otherwise flexed base load generation, with chemical storage buffering renewable intermittency no different than PHS buffers peaks. The energy cost alone would be about ($57/MWh baseload / 0.3 efficiency) $190/MWh. Ballard’s ClearGen® costs about $10 million/MW (including inverter, transformer, and installation).That calculates a capital LCOE of about $114/MWh. Adding hydrolysis and H2 storage, the system LCOE is >>$304/MWh. It is simply not commercially viable–by nearly an order of magnitude. Before solving the hydrogen storage problem.

Methane

Or, hydrogen from electrolysis could be reacted with CO2 over nickel catalysts to produce methane. Methanation is significantly exothermic, although up to half of the resulting ~20% ‘waste’ heat could be reused (e.g. heating input feedstock, since the catalysis works between 200C and 550C). A number of lab scale reactors plus at least one pilot facility have been built, with methane yields from ~70% for one pass to ~95% for three. Solves the hydrogen storage problem. The resulting synthetic methane can be stored and used like natural gas from any other source (e.g. in flexible CCGT with 58-61% efficiency). Input CO2 could theoretically be obtained from fossil fuel carbon capture (without sequestration), a process with 20-30% parasitic energy loads.

Methane round trip energy efficiency would be about 0.75 (hydrolysis) * 0.95 (catalysis yield) * 0.9 (net [half] methanation exothermic loss) * 0.8 (minimum CC parasitic load) * 0.6 (flexed CCGT) or ~31%— no better than hydrogen alone, after all the chemical complications. Methane storage avoids the technical hydrogen storage challenge, but at the expense of much additional chemical plant capital, operations, and maintenance cost. It worsens the chemical storage economics.

Conclusions

Most renewables advocates don’t appreciate the scope and scale of electricity grids, the difficulties intermittency creates, and the technical/ commercial inadequacies of electricity storage technologies other than PHS.

Utilities already utilize four out of five forms of energy storage wherever they make sense. Potential energy is ubiquitous pumped storage. Kinetic energy is ubiquitous synchronous condensers. Electrostatic energy is ubiquitous capacitors and statcoms. Conventional electrochemical batteries are not practical except in special situations, and probably never will be. Flow batteries may improve on conventional batteries somewhat, but are still far from feasible for large-scale bulk wind and solar storage needs. Chemical storage is even worse than batteries because of its inherently greater thermodynamic inefficiency.

It is very unlikely that any grid storage solution (other than PHS where feasible) could ever practically cover the intermittency of high penetration utility scale wind and solar. Utility voices (like RWE and E.ON) charged with making electricity grids work seamlessly and reliably despite ever increasing renewable intermittency burdens are only starting to be heard. Those voices are very negative. It may not be until some grid goes dark because of intermittency (as increasingly uneconomic flexed conventional generation is shut in Germany and UK) that the general public will understand. Germany, UK, and California seem determined to run this unfortunate experiment for the rest of us. One or more appear likely to succeed soon in experimentally proving the grid instability ‘blackout’ hypothesis. The question is mainly when, not if.
Climate Etc.

studying candle

More Evidence, that Wind Power is a FRAUD!

The Wind Power Fraud (in pictures): Part 1 – the South Australian Wind Farm Fiasco

Definition of fraud

****

In today’s post we lay out the wind power fraud in pictures, as it’s perpetrated in, what’s referred to as, ‘Australia’s wind power capital’, South Australia (tomorrow we expand the net to capture the debacle on the entire Eastern Grid).

To call the ‘performance’ of SA’s 17 wind farms (spread over a vast area of the State – with an installed capacity of 1,477MW) over the last few months “diabolical” is to flatter them.

SA’s Labor government has been talking up a wind powered future for months now – it’s presiding over the worst unemployment in the Nation, at 8.2% and rising fast – and seems to thinks the answer is out there somewhere – ‘blowin’ in the wind’. The fact that its wind power debacle has led to South Australians paying the highest power costs in the Nation – if not (on a purchasing power parity basis) the highest in the world – and, yet, the dimwits that run it wonder why it’s an economic train wreck (see our posts here and here).

Well, today, STT – always ready to rain on the wind industry’s parade – as well as the gullible and corrupt that cheer it on – spells it out in pictures – that even the most intellectually interrupted should be able to grasp.

The derisory data that follows comes courtesy of Aneroid Energy. We’ll start with a quick look at SA’s monthly performance (oh, and if the graphs appear fuzzy, click on them and they’ll pop up crystal clear in a new window).

May 2015 SA

Looking a bit like the meanderings of a drunken spider that had dipped one leg in the ink-well and staggered over the page, that’s the nonsense that wind farms can deliver power as an “alternative” to on-demand power generation sources such as hydro, gas and coal belted, yet again.

With 31 ‘chances’ to make a meaningful contribution to lighting up the230,000 homes said by wind power outfits to be ‘powered’ by their wind farms in SA – output collapses 13 times to less than 100MW – or less than 6.8% of the total installed capacity of 1,477MW.

Here’s the total output from all wind farms in SA for June 2015.

June 2015 SA

Having hardly lit up the screen for much of May, you’d think that June would see a better effort – but, oh no. Total output spends more time below 200MW (or 13% of installed capacity) than above. And hits the bottom of the pool more than 7 times – with ‘output’ failing to power a single kettle – let alone the hundreds of thousands of SA homes we’re constantly told are ‘powered’ by the wind.

Here’s the total output from all wind farms in SA for the start of July 2015.

July 2015 SA

Looking more like the fat bloke bouncing around in the deep-end of the local pool, after a long lunch, July’s effort (so far) isn’t much better than the months before.

A couple of short-lived ‘spurts aside, and the rest is largely a ‘joke’: crashing by around 1,000 MW over 24 hours; and almost repeating the ‘performance’ a few days later with a precipitous plummet of over 500 MW in a couple of hours – makes it pretty clear that the words ‘reliable’ and ‘wind power’ don’t belong on the same page, let alone in a sensible sentence.

Spending days struggling to produce 200MW; hours and hours producing less than half that (or less than 6.7% of capacity); and 50MW (3.38%) or less for hours at a stretch, tends to take the gloss off the glory heaped on SA’s wind power dream; and suggests its future will be more of an energy nightmare.

Having taken a ‘helicopter view’, we’ll zoom in now – for a closer look at some of the more outlandish results on: May 3, 16, 25 and 26; June 12, 13, 14, 16, 17, 20, 29 and 30; July 2, 3 and 7.

3 May 2015 SA

Entire SA Grid – 3 May 2015 – from midnight to 9pm (21hrs):

Total wind farm output: midnight to 9pm – never more than 100MW; from 3am to 8pm (17hrs) – never much more than 50MW; and during the same period collapsing to ZERO around 6am, and 5pm to 6pm.

Output as a percentage of total installed wind farm capacity: midnight to 2 am – 3.4%; 7am to 2pm – 1.7%; 2am to 9pm – 3.38%; 6am and 5pm to 6pm – ZERO%.

16 May SA

Entire SA Grid – 16 May 2015 – from 1am to 12.30pm – a total collapse of 720MW to ZERO:

Total wind farm output: 11.30am to 5pm (5.5hrs) – never more than 100MW; collapsing to ZERO from 12.30pm to 2pm (1.5hrs).

Output as a percentage of total installed wind farm capacity: 11.30am to 5pm (5.5hrs) – never more than 6.8%; collapsing to ZERO% – from 12.30pm to 2pm (1.5hrs).

25 May SA

Entire SA Grid – 25 May 2015 – from 8am to noon – a collapse of 325MW to ZERO – a 100% drop in output, in around 4hrs.

Total output: from 11am to 9pm (10hrs) – never more than 50MW; from noon to 4pm (4hrs) – ZERO.

Output as a percentage of total installed wind farm capacity: 11am to 9pm – less than 3.85%; from noon to 4pm – ZERO%.

26 May SA

Entire SA Grid – 26 May 2015 – from midnight to 6pm (18hrs):

Total wind farm output: from midnight to 6pm – never much more than 350MW; from midnight to 2am 150MW; from 8am to 4pm – never more than 200MW; and falling to 90MW at 11am.

Output as a percentage of total installed wind farm capacity: from midnight to 2am – 10%; 8am to 4pm – never more than 13.5%; and dropping to 6.1% – at 11am.

Now for a closer look at June 2015.

12 June SA

Entire SA Grid – 12 June 2015 – from midnight to 4pm a collapse of over 600MW:

Total wind farm output: 10am to 6pm – less than 150MW; 3pm to 5pm – dropping to 50MW.

Output as a percentage of total installed wind farm capacity: 10am to 6pm – 10%; and 3pm to 5pm  – dropping to 3.85%.

13 June SA

Entire SA Grid – 13 June 2015 – from 9am to 3pm – a collapse of 750MW – 800MW to 50MW – or an output drop of 94% – at a rate of 125MW/hour:

Total wind farm output: from 2pm to 8pm – never much more than 100 MW; from 3pm to 5pm – around 50MW.

Output as a percentage of total installed wind farm capacity: 2pm to 8pm – between 6.8% and 10%; 3pm to 5pm – around 3.85%.

14 June SA

Entire SA Grid – 14 June 2015 – from 8am to 3pm – a collapse of over 650MW – from 700MW to 30MW – or a 96% drop in output:

Total wind farm output: from 1pm to 4pm (3hrs) – less than 100MW – dropping to 30MW.

Output as a percentage of total installed wind farm capacity: 1pm to 4pm – less than 6.8% – dropping to 2.03%.

16 June SA

Entire SA Grid – 16 June 2015 – 24 hours – never more than 140MW:

Total wind farm output: from midnight to 5pm (17hrs) – less than 30 MW; from 3am to 7am (4hrs) – ZERO; falling to ZERO between 9am and 11am.

Output as a percentage of total installed wind farm capacity: never more than 10% for the entire 24 hour period; midnight to 5pm – less than 2%; with ZERO% produced for around 5hrs.

17 June SA

Entire SA Grid – 17 June 2015 – 24 hours – never more than 260MW – or 17.6% of capacity:

Total wind farm output: from 5am to 8am – less than 140MW; dropping to 100MW at 8.30am.

Output as a percentage of total installed wind farm capacity: never more than 17.6%; 5am to 8am less than 9.4%; falling to 6.8%.

20 June SA

Entire SA Grid – 20 June 2015 – from midnight to 6pm (18hrs) – never more than 70MW:

Total wind farm output: from midnight to 6pm – less than 70MW; 3am to 6am (3hrs) – around 25MW; from 1pm to 6pm (5hrs) – 25MW; falling to 10MW – around 4pm.

Output as a percentage of total installed wind farm capacity: midnight to 5pm – less than 4.7%; 3am to 6am – 1.7%; 1pm – 6pm – 1.7%, falling to 0.7% – at 4pm.

29 June SA

Entire SA Grid – 29 June 2015 – from 3am to 1pm – an almost total collapse of 550MW to 10MW – or a 98% drop in output:

Total wind farm output: from 1pm to 5pm (4hrs) – never more than 10MW; from 6pm to midnight (6hrs) – 50MW – briefly rising to 170MW and dropping to 90MW.

Output as a percentage of total installed wind farm capacity: from 1pm to 5pm – 0.7%; 6pm to midnight – 3.3% – briefly rising to 11% – dropping back 6.1%.

30 June SA

Entire SA Grid – 30 June 2015 – for the 24 hour period – never more than 200MW:

Total wind farm output: from 1am to 7pm (18hrs) – never more than 80MW; from around 3am to around noon – less than than 40MW and closer to 20MW for that period; falling to less than 20MW around 4pm.

Output as a percentage of total installed wind farm capacity: 1am to 7pm (6hrs) – never more than 5.4%; from around 3am to around noon (9hrs) – less than than 2.7% and closer to 1.3% for that period; falling to less than 1.3% around 4pm.

Now a look at the scoreboard for July, so far.

2 July SA

Entire SA Grid – 2 July 2015 – a total collapse of output over the period – 700MW to around 10MW:

Total wind farm output: from noon to midnight (12hrs) – never more than 150MW; generally around 100MW – falling to 10MW around 10pm to midnight.

Output as a percentage of total installed wind farm capacity: from noon to midnight (12hrs) – never more than 10%MW; generally around 6.8% – falling to 0.7% around 10pm to midnight.

3 July SA

Entire SA Grid – 3 July 2015 – for the 24 hour period – never more than 150MW:

Total wind farm output: from midnight to 3am (3hrs) – never more than 20MW; twice falling to around 10MW; short burst to reach 80MW by 6am; dropping back to 40MW by 8am; with peaks and troughs later in the day – before dropping back to less than 100MW – 7pm to midnight.

Output as a percentage of total installed wind farm capacity: never more than 11% for the 24 hour period; much of it producing less than 6% – and often less than 2%.

7 July SA

Entire SA Grid – 7 July 2015 – from 2am to 1pm – a collapse (almost total) of 450MW – from 470MW to 20MW – or a 97% drop in output:

Total wind farm output: from 10am to midnight (14hrs) – never more than 60MW; twice falling to less than 20MW; and to ZERO around 10pm to midnight.

Output as a percentage of total installed wind farm capacity: from 10am to midnight (14hrs) – never more than 4.1%; twice falling to less than 1.3%; and to ZERO% – around 10pm to midnight.

We’re bored now – we’ve made our point: the idea that SA (or anywhere else for that matter) can ditch fossil fuel power generation sources and – by relying on wind power – go ‘100% renewable’ is pure fantasy.

Anyone who – after perusing the pitiful pictorial above – tries to tell you otherwise is probably not playing with the full deck. Either that, or they’ve got their trotters firmly planted in the wind power fraud trough.

At STT we love scorching wind power myths – and all the more so when it can be done with pictures.

In the last few months the lunatics from the fringes of the Labor party – and other hard-green-left nutjobs – have ramped up their rhetoric – pressing all and sundry join in their ultimate mission to go “fossil free” – they mean abstaining from the use of “fossil fuel”, rather than ceasing to rely on T-Rex and his – now stony/boney – kin. Although they have no apparent hesitation when it comes to burning up millions of litres of kerosene, flying to groovy backpacker must-sees, and “climate change” jamborees, all over the globe (see our post here).

Contrary to the anti-fossil fuel squad’s ranting, there isn’t a ‘choice’ between wind power and fossil fuel power generation: there’s a ‘choice’ between wind power (with fossil fuel powered back-up equal to 100% of its capacity) and relying on wind power alone. If you’re ready to ‘pick’ the latter, expect to be sitting freezing (or boiling) in the dark more than 60% of the time.

Wind power isn’t a ‘system’, it’s ‘chaos’ – the pictures tell the story.

One thing that amuses the STT gang, is seeing links to our posts appearing on the comments pages of online news sites, blog forums and the like: often they’re dropped into a ‘debate’ about the ‘wonders of wind’, with an apparently gleeful ‘splat’ – in a ‘get around that, and play fair’ kind of moment – that usually pulls the ‘debate’ to a shuddering halt.

STT predicts that this is going to be one such post.

So, next time you find yourself dealing with the intellectual pygmies, that are still clinging to their wind power myths and fantasies, why not flick them a link to this post – or have a little fun with an STT ‘splat moment’, on their favourite blogs and news sites?

Why not pitch a few sitters along with it, such as: on 3 May; after lunch on 25 May; after lunch on 13 June; on 16 June; on 20 June; and after lunch on 7 July:

How many South Australian homes (not kettles) were actually being powered by ‘wonderful wind’?

Where did all the power come from that kept the lights on and got the kettles boiling?

Was it coal? Was it gas? Or a bit of both?

In the light of your last answer, how much ‘dreaded’ CO2 gas was saved by SA’s 17 wind farms?

And what effect did wind power have on power prices in SA’s wholesale market for electricity?

We don’t expect them to enjoy it; but wind power worshippers have never been that keen on the facts.

Facts

Silly German Windpushing Politicians….They can’t Say We Didn’t Warn Them!

Germany’s Wind Power Debacle Escalates: Nation’s Grid on the Brink of Collapse

German wind farm

Calamitous Planning: German Wind Parks Overload Power Grid … “At Its Limits” … Record 50,000 Grid Interventions In May!
NoTricksZone
Pierre Gosselin
1 July 2015

Online German NDR public radio here wrote last week how northern Germany’s power grid had suffered a major bottleneck that led to the overload of the Flensburg-Niebüll power transmission line in Schleswig Holstein last week.

Transformer

North German transformer stations constantly overloaded by wind power. Photo image cropped here (not a German station, for illustration only).

The overload resulted from a power surge from North Sea wind parks when winds picked up a bit. What is unusual in this case, however, is that there was no storm present and the overload was caused by normal wind fluctuations. Thus the incident illustrates the increasing volatility of wind as a power supply, even under regular weather conditions.

At its limits

It turns out that intervening in power grids to avert a widespread power supply breakdown is nothing new in Germany. NDR writes that nowadays power engineer Stefan Hackbusch at the grid’s control center in Northern German increasingly has to intervene even when there are even moderate breezes. The north German public radio media outlet writes: “Because of the strong growth in wind park installations, the power grid up north is at its limits.”

Intervened 50,000 times in May

As winds pick up with little warning, engineers at control centers constantly have to keep a close eye out and be ready to act at a minute’s notice and intervene if the power surges (or drops) to dangerous limits. To prevent overloading of the grid, control centers often have to shut down wind parks until the power supply moves into a safe range. These unplanned wind park shutdowns are occurring more and more often, NDR writes. “Switching off has become much more frequent the workers at the control center confirm. Transformer stations in Schleswig-Holstein had to have their output reduced 50,000 times in May – a record.

“Waste electricity” skyrocketing

Not only is grid stability a problem, but “waste power” is also growing astronomically, NDR writes, citing the Bundesnetzagentur (German Network Agency), that 555 gigawatt-hrs of renewable power went unused in 2013 because of overloading and the surplus had to be discarded. The trend of “waste electricity” is skyrocketing, NDR writes.

According to the provisions of Germany’s EEG renewable energy feed-in act, waste electricity still needs to be paid for, which means that consumers foot a bill for something that is never delivered. Consumers are also required to pay for the electricity that doesn’t get produced when a wind park gets shut down. Wind park operators get paid whether they feed in or not.

Grid bottleneck dampens new installations

One solution for the German grid overloading from the uncontrollable wind and sun sources would be to vastly expand the German national power grid so that wind power produced near the North and Baltic seas power could get transmitted to the industrial south, where demand is big.

But here too the costs of building the such transmission power lines are astronomical and permitting entails a bureaucratic mess.

Moreover political opposition against these lines is mounting rapidly. Experts say that the earliest, most optimistic completion date for a major power transmission expansion is 2022. This however is now looking totally unrealistic, as pie in the sky.

With the German grid often becoming hopelessly overloaded and with no real expansion in sight, the future looks bleak for wind and solar power systems suppliers.

With no place to send the power, there’s no need for new installations. Orders and contracts for new projects have been drying up and wind and solar companies are now being hit hard.
NoTricksZone

studying candle

What appears above isn’t exclusive to Germany, it’s part and parcel of trying to integrate an entirely weather dependent generation “system” into electricity grids designed to operate in a steady, stable state; and that includes Australia.

In the video that follows, an electrical engineer, Andrew Dodson explains – in somewhat technical terms – the lunacy of trying to distribute wind power via a grid deliberately designed around on-demand generation sources. STT recommends it to anyone with even the vaguest interest in how our electrical grid works.

At the simplest level, think of our distribution grid as akin to a mains water distribution system. In order to function, the pipes in such a system need to be filled at all times with a volume of water equal to their capacity and, in order to flow in the direction of a user, the water within the pipes needs to be maintained at a constant pressure.

Where a household turns on a tap, water flows out of the tap (in electrical terms “the load”); at the other end an equal volume of water is fed into the system and pumps fire up to maintain the pressure within it (although gravity often does the work).

In a similar fashion, an electricity grid can only function with the required volume of electricity within it; maintained at a constant pressure (voltage) and frequency (hertz) – all of which fluctuate, depending on the load and the input.

What Andrew Dodson makes crystal clear is that these essential certainties (essential, that is, to maintaining a stable and functioning electricity grid) have been tipped on their head by the chaos that is wind power.

What Andrew has to say about wind power, in general, has special pertinence to Australians; given the fact that our Coalition government has just locked in a $45 billion electricity tax – which is to be directed at wind power outfits; and for no other purpose than to help them spear another 2,500 of these things all over the country.

****

Realistic View Of Government-induced Climaphobia, & the Unintended Consequences”.

Editorial by Tom Harris
July 8, 2015
‘Marching with the enemy’
Imagine pro-tobacco groups wanted to participate in fund raising marches for cancer research. ‘We want to help defeat cancer too,’ the tobacco advocates announce.
Anti-cancer campaigners would never march in solidarity with tobacco promoters. They know that if smoking increased, cancer rates would undoubtedly rise as well. Marching arm in arm with those working against one’s interests is irrational.
This logic does not seem to have occurred to the groups concerned with social justice and wildlife protection who participated in the July 5 “March for Jobs, Justice, and the Climate” in Toronto. They were, in effect, marching with the enemy, groups such as  and Citizens’ Climate Lobby which unwittingly encourage outcomes that are harming the poor and disadvantaged, biodiversity, and endangered species.
For example, by promoting the idea that carbon dioxide (CO2) emissions must be reduced to prevent dangerous climate change, climate mitigation activists support the expanded use of biofuels. This is resulting in 6.5% of the world’s grain being diverted to fuel instead of food, causing food price spikes that are a disaster for the world’s most vulnerable people.
The growing demand for biofuels is also creating serious problems for indigenous land owners in developing countries. In a February 2015 open letter to the European Parliament endorsed by 197 civil society organisations from Asia, Africa, and Latin America, it was asserted:
“The destruction of forests and fertile agricultural land to make way for oil palm plantations is jeopardising the food sovereignty and cultural integrity of entire communities who depend on the land as their source of food and livelihoods.”
Replacing virgin forests with monoculture plantations to provide palm oil for biodiesel greatly reduces biodiversity over vast regions.
In another attempt to reduce CO2 emissions, hundreds of thousands of industrial wind turbines (IWT) are being constructed worldwide. For example, the Ontario government is erecting 6,736 IWTs across the province, the most recent as tall as a 61 story building.
Only 4% of the province’s power came from wind energy in 2013 and 1% from solar, yet together they accounted for 20% of the commodity cost paid by Ontarians. Despite massive government subsidies for wind power, electricity rates in Ontario have soared, mostly affecting the poor and seniors on fixed incomes.
IWTs kill millions of birds and bats across the world. Ontario’s situation has drawn the attention of the Spain-based group, Save the Eagles International, which, on May 23, issued the news release “Migrating golden eagles to be slaughtered in Ontario.” They showed that some of the turbines planned for Ontario are being placed directly in the path of migrating golden eagles, which are already an endangered species.
The consequences for people living near IWTs can be severe as well. Besides a significant loss in property value, health concerns abound.
A particularly tragic example is occurring in the West Lincoln and surrounding regions of Southern Ontario.  There, despite the objections of local residents, wind developers have received approval to install at least seventy-seven 3 Megawatt IWTs, each up to 609 ft. tall, the largest such machines in North America.
One resident, Shellie Correia of Wellandport has a particular reason to be concerned.
Her 12 year old son Joey has been diagnosed with Sensory Processing Disorder and it is crucial that he live in an environment free from excessive noise. But as a result of Ontario’s Green Energy Act, the primary focus of which is climate change mitigation, an IWT will be sited only 550 metres from their home.
Correia explained in her January 2015 presentation before the government’s Environmental Review Tribunal, “On top of the incessant, cyclical noise, there is light flicker, and infrasound. This is not something that my son will be able to tolerate.”
But the approvals go ahead anyways. As Correia told the Tribunal, “No one was able to help, because of the Green Energy Act.”
The drive to reduce CO2 emissions makes it difficult for developing countries to finance the construction of vitally-needed hydrocarbon-fueled power plants. For example, in 2010 South Africa secured a $3.9 billion loan to build the Medupi coal-fired power station only because developing country representatives on the World Bank board voted for approval. The U.S. and four European nation members abstained from approval because of their concerns about climate change. They apparently wanted South Africans to use wind and solar power instead, sources too expensive for widespread use even in wealthy nations.
Finally, because of the belief that humans control climate, only 6% of the one billion dollars spent every day across the world on climate finance goes to helping vulnerable people cope with climate change today. The rest is spent trying to stop phenomena that might someday happen.  This is immoral, effectively valuing the lives of people yet to be born more than those in need today.
In all of these cases, climate mitigation takes precedence over the needs of the present. Groups such as Ontario Coalition Against Poverty, Oxfam Canada, and Great Lakes Commons, all of which participated in Sunday’s event, must distance themselves from climate activists, not march with them.
Tom Harris is Executive Director of the Ottawa-based International Climate Science Coalition.

How Climate Alarmism Hurts All of Us! Stop Government-Induced “Climaphobia!”

Wind Will Never Be More Than “Novelty Energy”. Investors are Waking Up to Reality!

Global Investment Collapses: Investors Wake Up to the Wind Power Delusion

delusion

***

The wind industry is in meltdown around the globe, simply because investors have woken up to the monumental RISKS.

Risks like: – turbines falling apart in less than 2 years; under pressure from voters, governments pulling the plug on the massive subsidies essential to keep the scam rolling; neighbours suing the operators toobtain compensation and/or to have turbines shut down or removed.

In response to these pretty obvious risks, the amount being stumped up by investors to build more of these things has plummeted.

The scam is little more than the latest Ponzi scheme – with Australia’s best and brightest at Union Super Fund backed Pacific Hydro losing $700 million of mum and dad retirement savings; with its parent – IFM Investors – deciding to ditch Pac Hydro and Pac Hydro deciding to ditch its Cape Bridgewater wind farm disaster.

While the wind industry’s parasites and spruikers try hard to pin their woes in Australia on dreaded policy “uncertainty”, the situation in Europe – held up by eco-fascists as the wind power Super Model – is just as dire.

The amount being thrown by investors at wind power has dropped off a cliff; in the UK, with David Cameron’s election win, subsidies have been pulled to a halt and, as an inevitable result, hundreds of threatened projects have been blown to the four winds.

Behind it all is the simple fact that wind power is not, and will never be, a meaningful power generation source. Here’s a solid analysis, that exposes the delusion and details the imminent collapse of the greatest economic and environmental fraud of all time.

The Difficulties Of Powering The Modern World With Renewables
Roger Andrews
10 June 2015
Energy Matters

In the May 12, 2015 “G7 Hamburg Initiative for Sustainable Energy Security”, the energy ministers of Canada, France, Germany, Italy, Japan, the United Kingdom and the United States, plus the European Commissioner for Climate Action and Energy, said this:

An increasing number of countries are following the path of a rapid expansion of renewable energy. There (are) a number of challenges as energy systems change and related greenhouse gas emissions are reduced, one of which is how to integrate growing shares of variable renewable energy into electricity systems.

The G7 energy ministers are correct in their assessment. Integrating growing shares of variable renewable energy into electricity systems is indeed a challenge – and so far one without a good solution.

A few quick facts before proceeding. In 2013 renewables supplied the world with 21.7% of its electricity, according to BP. Take out hydro and they supplied the world with only 5.3% of its electricity. Then take out “other” renewables such as biomass and geothermal and the percentage falls to 3.3%.

Why take out hydro and “others”? Because their growth potential is limited by resource availability – too few good hydro sites, too few high-temperature geothermal fields, not enough wood to make biomass pellets etc. – and for these reasons they may never make a significant contribution to future global energy needs. Their growth performance since 1997, the year the Kyoto Protocol set the renewables bandwagon rolling, has certainly been less than impressive, as illustrated in Figure 1. “Others” have gained market share, but at a painfully slow rate, and hydro has actually lost ground:

1-400

****

Not so, however, for wind and solar, which aren’t resource-limited (the amount of solar energy hitting the earth in a year, for example, vastly exceeds annual global energy consumption). They show rapid growth since 1997, although from small beginnings. Clearly they are the energy sources the world must concentrate on developing if it is ever to “go green”.

And why shouldn’t continued rapid growth in wind and solar allow the world to go green? I’ve discussed the reasons piecemeal before. Here I summarize them all in the same post:

Intermittency

Intermittency, or non-dispatchability, is the Achilles heel of wind and solar. So far it hasn’t caused widespread problems because wind and solar still contribute only a small fraction of total power generation in most countries. Integrating wind power into the UK grid in February 2013, for example, was not difficult because wind only supplied 5% of the UK’s electricity in that month:

2-400

***

But if in February 2013 the UK had had enough installed wind capacity to generate 50% of its electricity from wind Figure 2 would have looked like this:

3-400

***

Now it’s a different ball game. How do we match a generation curve like that to demand, or at least smooth it out to the point where it becomes manageable? There is in fact a way of doing it, but we’ll get to it later. First we will discuss the options that won’t work.

Energy Storage

This is the obvious solution; store intermittent renewable energy during periods of surplus generation and release it during deficit periods. But the only existing technology that can do this at the scale necessary is pumped hydro, and as discussed at length in previous posts here,here and here the amount of pumped hydro storage needed is enormous. At only moderate levels of solar & wind penetration the UK would need several terawatt-hours of storage, maybe as much as a hundred times the capacity of its existing pumped hydro plants, while Europe and the US would need tens of TWh each and the world proportionately more. There is no realistic prospect of bringing this much new pumped hydro – or even conventional hydro, which can also function in an energy-storage mode – into service in the foreseeable future even if enough suitable hydro sites could be found.

The alternative is battery (or flywheel, or compressed air, or thermal) storage. These technologies are so far from deployment on the multi-terawatt-hour scale that they can be discounted. (According toWikipedia total world battery + CAES + flywheel + thermal storage capacity still amounts to only about 12GWh, enough to fill global electricity demand for all of fifteen seconds.)

Another option that’s been mooted as a potential solution to the storage problem is electric vehicle batteries, which can be charged from the grid during periods of generation surplus and discharged back into the grid during periods of deficit. But this option also founders on the rock of scale. Assuming a 100% charge/discharge capability and no energy losses during the charge/discharge process we would still need 12 million 85kWh Teslas (or 42 million 24kWh Nissan Leafs) to get a single terawatt-hour of storage.

Grid Interconnections

It’s frequently assumed that a smart grid covering a large enough area, like the proposed European supergrid, will be able to smooth out local spikes and troughs in renewables generation and provide “reliable electricity” to all. Unfortunately it won’t. Figure 4, reproduced from Wind Blowing Nowhere compares 2013 wind generation in Spain, the largest producer, with combined wind generation in Belgium, the Czech Republic, Denmark, Finland, France, Ireland, Germany, Spain and the UK. Combining wind generation from all nine countries doesn’t flatten out the Spanish spikes or fill in the Spanish troughs. It just moves them around:

4-400

***

What about solar? Seasonal and diurnal variations in solar generation can be smoothed out by combining output from different areas, but the European supergrid would have to link up with New Zealand to do it.

Combining Generation from Different Renewable Sources

It’s also been claimed that because the wind and the sun blow and shine at different times we will get smoother power output when we combine them. That doesn’t work either. Figure 5 re-plots the Figure 2 case with the UK getting 40% of its electricity from wind and 10% from solar instead of 50% from wind. Adding the midday solar spikes, which lead evening peak demand by about five hours in the winter, if anything makes things worse:

5-400

***

Demand-side management

A lot of faith is pinned on the potential of DSM, which instead of matching generation to demand seeks to match demand to generation, or at least to match it as closely as possible. But there’s no way demand could be matched to the generation curves shown in Figures 3 or 5. The best that could be hoped for is an incremental improvement, maybe a flattening of the daily demand curve and/or a reduction in total demand, but the larger problem of how to smooth out bursts of intermittent power into a manageable form would remain unresolved.

And then there’s the great unexploited renewable resource:

Tide Power

It’s predictable, infinitely renewable and has near-unlimited potential. What’s not to like about it? As discussed in the Swansea Bay post (link above), quite a lot. Arguably the best indicator of tide power’s lack of potential, however, is that almost fifty years after the world’s first tide power plant went in at La Rance in France it still supplies less than 0.005% of the world’s electricity.

So if energy storage, supergrids, combining output from different sources, demand-side management and tide power won’t work, what will? Only one thing:

Fossil Fuel Backup

The concept is simple: use load-following fossil fuel capacity – I’m going to assume gas turbines – to generate the electricity needed to meet demand whenever renewable energy can’t generate enough. The approach requires no storage and imposes no theoretical limits on the level of wind & solar penetration, as discussed in How much windpower can the UK grid handle and Wind power and the island of Denmark. Figure 6 illustrates how it would apply to the 50% wind penetration case shown in Figure 2:

6-400

***

Inevitably, however, there are problems. One is that there are times when wind generation exceeds demand and has to be curtailed, and as a result the UK gets only about 47% of its electricity from wind instead of 50% in the above case. Another is the generation curve the gas turbines would have to follow to fill demand when wind generation can’t, which looks like this:

7-400

***

Tracking this erratic generation curve would severely stress the gas turbines (and probably the grid operators too). Wear, tear, downtime and generation costs would all increase, as would fuel consumption because of the constant start-up and shutdown, thereby offsetting some of the CO2 emissions reductions generated by the wind energy.

And that’s with 47% wind penetration. At higher levels the system becomes progressively more inefficient until at 80-90% penetration it’s running at load factors as low as 10% and well over half of the wind generation has to be curtailed (more details in the tables in the How much windpower post linked to above). We can therefore anticipate that this approach will also eventually run up against the hard wall of reality, if only because sooner or later it will occur to someone that it would be a lot easier to keep the dispatchable gas generation and do away with the non-dispatchable wind generation altogether.

But the way things are going there’s a good chance that this point will never be reached. Why? Because of a problem that’s rarely taken into consideration:

Lack of Investment

Every year UNEP publishes a chart of annual global investment in renewable energy, the lion’s share of which (92% in 2014) goes to wind and solar. Here’s the latest version:

8-400

***

Total investment in renewables since 2004 now exceeds $2 trillion – a lot of money, but it’s still far short of what’s needed to stimulate growth to the point where renewable energy, assuming it can be made to work, eventually powers the world. The $232 billion invested in renewables in 2013 was dwarfed by the $1.6 trillion total global energy investment in that year reported by IEA, and of the 235GW of new generation capacity installed globally in 2012 only 76GW was wind or solar, according to EIAand BP. If investments in conventional generation continue to dominate to this extent then wind and solar are doomed to remain also-rans. A very substantial transfer of investment from conventional generation to wind and solar will be needed if they are ever to become the dominant players, but the investment climate needed to achieve this just isn’t there.

Another question is whether global renewables investment might not already have peaked (as shown in Figure 8, it’s certainly flattened out). Renewables investment is still increasing in the developing countries – notably China – but it’s been essentially flat in the US since 2008 and in Europe it’s been declining since 2011. Europe in particular bears watching because if the decline continues at the rate shown in the Bloomberg New Energy Finance chart below it won’t be long before Europe will have had all the clean energy it’s going to get:

9-400

***

And finally the big problem. Even if the world succeeds in developing wind and solar to the point where they supply 100% of its electricity the job is still less than half-done because electricity supplies the world with only about 40% of its energy. The remaining ~60% comes from the oil, gas and coal consumed in transportation, heating etc. How to decarbonize that? Again no solution is presently in sight.
Energy Matters  

mirror-delusion-deluded

How the Wind Scam Is Destroying Europe’s Economy….Do We want to be Next?

Europe’s Wind Powered Recipe for Economic Disaster

spain unemployment

****

Lessons from Europe: Recipe for a high-cost energy system
Communities Digital News
Steve Goreham
26 May 2015

CHICAGO, May 26, 2015 — While President Obama promotes renewable energy and members of Congress argue about energy policy, a renewable energy disaster is unfolding in Europe. Driven by a desire to halt climate change, Europe has created a high-cost energy system where everyone loses. U.S. policy leaders should learn from the debacle occurring overseas.

European energy policy today is dominated by the European Climate Change Program (ECCP), which was established by the European Community in 2000. The program called for the nations of Europe to adopt measures to cut greenhouse gas emissions. The goal was for Europe to collectively meet the targets of the Kyoto Protocol climate treaty signed in 1997.

The ECCP was based on two assumptions. The first was that changes to national energy systems were needed to fight global warming. Second, that coal, gas and oil fuels would become more expensive, allowing renewable energy to compete. But policies to promote renewables resulted in substantially higher electricity prices for Europe.

Europe used subsidies and mandates to promote renewables. Feed-in tariffs were enacted in most nations, providing a payment to homeowners and businesses for electricity fed into the grid from solar or wind facilities. Governments paid a fixed subsidy of four to 10 times the wholesale electricity price, guaranteed for up to 20 years, for generated electricity.

Electricity from renewables is also granted grid priority. Utilities are required to accept wind and solar-generated electricity as a first priority, regardless of market demand. Output from traditional coal, natural gas and nuclear plants is scaled back or shut down when renewable output is high. Wholesale electricity prices, once driven by market demand, are today dominated by the weather. When the wind blows and the sun shines, large amounts of electricity are dumped onto the grid from wind and solar installations, forcing wholesale electricity prices negative.

Other factors added to the growing debacle. In 2011, Germanyannounced a complete phase-out of nuclear power in the wake of the Fukushima disaster in Japan, closing nuclear power plants and straining the electrical system of Europe’s largest economy. In addition, Germany and France banned hydraulic fracturing, ensuring that European natural gas prices will remain high for the next decade.

The results of Europe’s green energy measures have been bizarre. Feed-in tariffs in Germany stimulated more than one million rooftop solar installations. But Germany is not exactly the sun belt. The latitude of central Germany is the same as that of Calgary, Canada. As a result, German solar installations generate electricity at less than 10 percent of rated output. Over a million solar installations provide only 6 percent of Germany’s electricity and 1 percent of the nation’s energy. For this solar miracle, German citizens are obligated to pay over $400 billion in current and future payments to solar providers through higher electricity rates.

Denmark erected over 5,000 wind turbine towers, one for every thousand Danish citizens. Turbines blanket the nation, providing a beautiful view of a 300- to 500-foot tall tower from almost every house, farm, field, forest and beach. But the turbines produce only 1.3 gigawatts each of electricity on average. All could be replaced by a single large conventional power plant. Today, Denmark has the highest electricity prices of the developed nations.

Europe has created an energy system where everyone loses. Consumers, industry, traditional power plants and even renewable energy companies are now losing. Even though wholesale electricity prices are falling, consumer electricity prices have doubled over the last 10 years due to large subsidy payments to renewable companies. Nations with the largest percentage of renewable energy also have the highest electricity prices.

Citizens of Spain pay 23 eurocents per kilowatt-hour, three times the U.S. price, and citizens of Germany and Denmark pay more than 25 eurocents per kilowatt-hour, four times the U.S. price.

European industrial companies are also big losers. French firms pay more than twice the U.S. electricity rate and German firms pay three times the rate. European industrial electricity rates have risen more than 50 percent since 2007, while U.S. industrial rates have been flat. European firms also pay double the U.S. price for natural gas. European chemical firms are now building plants in America to utilize low-cost ethane from shale fracking, a technology not available in Europe.

Traditional European electrical power companies are losing as well. The wholesale price of electricity is down 50 percent in the last five years and conventional plants can no longer break even. An example is the Irsching high-efficiency natural gas plant in Germany. Built in 2010, it can operate at 60 percent efficiency. But the plant is not profitable as a backup to renewables. In March, the owners announced a shutdown of the plant.

Last year, E.ON, the largest German utility, suffered its first loss in more than 50 years. Both E.ON and Swedish utility Vattenfall have announced plans to exit their conventional power plant business in Germany in favor of renewables. Magnus Hall, president of Vattenfall, stated last year, “It makes it difficult to see how you could invest in conventional generation under these circumstances.”

Finally, even renewable energy companies are now losing. European governments have realized that they can no longer afford the green energy revolution. Subsidies have recently been cut in Belgium, Germany, Greece, Italy, Spain and the United Kingdom. In Germany, solar employment dropped 50 percent and many renewable companies declared bankruptcy. Spain ended its feed-in tariff subsidy and placed a cap on renewable industry profits, resulting in 75,000 lost renewable jobs and a 90 percent reduction in solar installations.

U.S. energy policy makers should learn from Europe’s energy experience and pursue sensible energy economics.

Steve Goreham is executive director of the Climate Science Coalition of America and author of the book The Mad, Mad, Mad World of Climatism: Mankind and Climate Change Mania.
Communities Digital News

economics101

Institute for Energy Research Tells the Truth About Renewables…

One more time–fossil fuel based (coal fired) energy is the most affordable/efficient and it is clean

You say could evil coal be clean enough–well it is.

And there is no air pollution risk that justifies the economic and human welfare damage that attaches to stupid renewables.

Nuke, Hydro, gas fired, coal in rank for emissions.

For affordable the ranks are hydro, coal, gas fired coal, gas, then the silly renewables like biomass, wind, with solar a dead last.

http://instituteforenergyresearch.org/wp-content/uploads/2015/06/ier_lcoe_2015.pdf

Bill Gates Admits that Wind & Solar are Not Suitable As An Energy Source… Spend $ On R&D!

Switch green subsidies into R&D

It is interesting that there is no US media coverage of this perspective from Bill Gates.  This article comes from the UK.  The UK doesn’t utilize direct taxpayer subsidies like the USA, but instead has forced a “Feed-in Tariff” on the grid, forcing electricity costs to skyrocket.  This, in turn, has led to poor and working class people to endure what has been termed “energy poverty” such that they must sacrifice heavily on other things to try to keep the lights on.

Excerpts from the article:

“Retired software kingpin and richest man in the world Bill Gates has given his opinion that today’s renewable-energy technologies aren’t a viable solution for reducing CO2 levels, and governments should divert their green subsidies into R&D aimed at better answers.”

Gates refers to the cost of meeting electricity needs on renewables as “beyond astronomical”

“In Bill Gates’ view, the answer is for governments to divert the massive sums of money which are currently funneled to renewables owners to R&D instead. This would offer a chance of developing low-carbon technologies which actually can keep the lights on in the real world.”

Bill Gates scorns those ideologues who want to end all fossil fuels and run the world on wind & solar power in this interesting article.  Here is the link:

http://www.theregister.co.uk/2015/06/26/gates_renewable_energy_cant…