How the media distort the news: Lesson 1 — Lies by omission
The Sydney Morning Herald carefully removed the scientific arguments from an article today. Are they afraid their readers are not smart enough to reach the “right” conclusions if exposed to the wrong information? Hey, but its only national policy and billions of dollars at stake.
Today Maurice Newman warned that we are not prepared for climate change (he’s talking about the cold kind). The Australian published his thoughts citing Archibald, Usoskin, Svensmark, Brekke, Lockwood and Curry. Their readers are apparently clever enough to handle discussions of cosmic rays and large hadron colliders.
In Sydney Morning Herald, Latika Bourke and Lisa Cox write an article about Newman’s views, but carefully omit all of the scientific arguments, as well as the potential problems with one sided science funding and the names and credentials of the scientists he talks about. The pair do, however, find space to repeat the litany of the IPCC’s estimate of 95% “probability” (it’s hard to believe Sydney Morning Herald readers have not heard this before). They don’t mention that the IPCC estimate is a speculative and unscientific number which gets paradoxically higher as the IPCC’s predictions are proven wrong. Nor did they interview Newman and ask him his opinion of this.
Rather than talking about possibilities that scientists are discussing, it was more important to remind SMH readers that Prime Minister Abbott once said climate change was “absolute crap”. How that helps the nation decide on national climate policy is not made clear, though the implication is: skeptics only have dumb arguments. No doubt SMH readers will understand which opinion they are supposed to hold, and “lucky” for them, journalists Bourke and Cox are experts on atmospheric physics, particle collisions, and climate modeling. If only they’d explained the flaws in Maurice Newman’s arguments instead of concealing them, the whole nation would have been better off.
One day, the poor SMH readers, like ABC viewers, might be shocked when they discover how they were fed propaganda lines by dutiful journalists who, no doubt, thought they were doing a good job. Still, one great thing about the SMH is that the citizens of Australia don’t have to pay for it if they don’t want to.
The Australian‘s readers already know the IPCC position. The editors there, dare to give us the other side as well:
We’re ill-prepared if the iceman cometh
- MAURICE NEWMAN
- The Australian
- August 14, 2014 12:00AM
WHAT if David Archibald’s book The Twilight of Abundance: Why Life in the 21st Century Will Be Nasty, Brutish, and Short turns out to be right? What if the past 50 years of peace, cheap energy, abundant food, global economic growth and population explosion have been due to a temporary climate phenomenon?
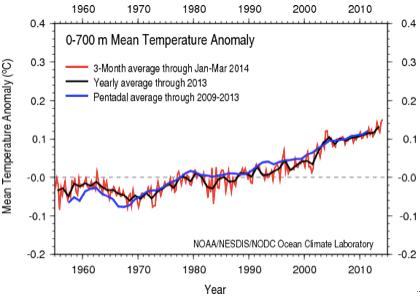
What if the warmth the world has enjoyed for the past 50 years is the result of solar activity, not man-made CO2?
In a letter to the editor of Astronomy & Astrophysics, IG Usoskin et al produced the “first fully adjustment-free physical reconstruction of solar activity”. They found that during the past 3000 years the modern grand maxima, which occurred between 1959 and 2009, was a rare event both in magnitude and duration. This research adds to growing evidence that climate change is determined by the sun, not humans.
Newman talks about the one-sided funding in the US that largely “preordains” scientific conclusions and the cycle of governments funding scientists, who help fund governments, who fund more sympathetic scientists…
This mindset sought to bury the results of Danish physicist Henrik Svensmark’s experiments using the Large Hadron Collider, the world’s most powerful particle accelerator. For the first time in controlled conditions, Svensmark’s hypothesis that the sun alters the climate by influencing cosmic ray influx and cloud formation was validated. The head of CERN, which runs the laboratory, obviously afraid of how this heretical conclusion would be received within the global warming establishment, urged caution be used in interpreting the results “in this highly political area of climate change debate”. And the media obliged.
But Svensmark is not alone. For example, Russian scientists at the Pulkovo Observatory are convinced the world is in for a cooling period that will last for 200-250 years. Respected Norwegian solar physicist Pal Brekke warns temperatures may actually fall for the next 50 years. Leading British climate scientist Mike Lockwood, of Reading University, found 24 occasions in the past 10,000 years when the sun was declining as it is now, but could find none where the decline was as fast. He says a return of the Dalton Minimum (1790-1830), which included “the year without summer”, is “more likely than not”. In their book The Neglected Sun , Sebastian Luning and Fritz Varenholt think that temperatures could be two-tenths of a degree Celsius cooler by 2030 because of a predicted anaemic sun. They say it would mean “warming getting postponed far into the future”.
If the world does indeed move into a cooling period, its citizens are ill-prepared.
The media IS the problem. With better media, we’d have better politicians, better bureaucrats, and better policy.