Government-induced Climaphobia….It’s a Huge Money-Grab!

Climate of intimidation

The idea only so-called ‘experts’ can debate global warming policies is an attack on free speech

lorrie-goldstein

BY , TORONTO SUN

FIRST POSTED: SATURDAY, OCTOBER 31, 2015 03:06 PM EDT | UPDATED: SATURDAY, OCTOBER 31, 2015 04:40 PM EDT

Climate Change protesters
A protester, wearing a Halloween mask, stands near a protest banner during a rally near the Presidential Palace to protest the country’s use of coal to power energy generation power plants which according to them has contributed to pollution Saturday, Oct. 10, 2015 in Manila, Philippines. The protesters are urging the Government to do more to reduce Greenhouse gas emissions which allegedly contributes to global climate change. (AP Photo/Bullit Marquez)

The easiest way to distinguish between a critical thinker and an ideological one is this.

When a critical thinker disagrees with you, he or she thinks you’re wrong.

When an ideologue disagrees with you, he or she thinks you’re evil.

When it comes to discussions about climate change, we have far too many ideologues and far too few critical thinkers.

Far too many self-proclaimed “environmentalists” who want to shut down all debate on the subject because their narrow and rigid ideological minds believe there is only one “correct” position — theirs — which saves them from having to think.

These are the folks who condemn anyone who disagrees with them as “climate change deniers”, a dogwhistle meant to smear anyone who deviates from climate change orthodoxy as the equivalent of a denier of the Holocaust.

I was reminded of this tactic Thursday in the lead-up to a discussion about political responses to climate change in which I was a panelist before a group of Ryerson University MBA students.

My fellow panelist was Andreas Souvaliotis, Executive Chairman of Social Change Rewards Inc. and we both appeared at the invitation of prominent Toronto lawyer Ralph Lean, who organizes a speaker series for Ryerson students.

The problem wasn’t with the students, who asked thoughtful and intelligent questions, nor with my fellow panelist, nor with Lean nor with the students’ professor, Dr. Asher Alkoby, a gracious and open-minded host.

Of course, open-mindedness should be expected in a university setting, but sadly, today that is decreasingly the case as more and more so-called institutions of higher learning replace critical thought with ideological thinking, intellectual laziness and academic decline.

Amusingly, the very mention of the idea on twitter by Ryerson’s MBA program that two non-scientists were about to discuss issues related to climate change was enough to freak out various and sundry self-proclaimed environmentalists, who have appointed themselves the arbiters of who can and who cannot discuss the issue.

Their attitudes, in and of themselves, are insignificant and unimportant.

But they speak to a wider concern that goes to the very heart of our fundamental notions of free speech, critical inquiry and indeed to the essence of the scientific method itself, which is built upon rational skepticism, not the unthinking acceptance of orthodoxy and received wisdom.

Far too often in the climate change debate, the people who will be most affected by government policies to deal with it — meaning all of us — are excluded on the basis that we are not “experts” on climate science.

I have seen this tactic used repeatedly over the years — most disgracefully by some politicians — to intimidate people into silence about expressing their views on climate change and its so-called “solutions” such as carbon taxes, cap-and-trade and wind and solar power.

This claim that climate change is the sole purview of “experts” is not only an attack on free speech and critical inquiry, it demonstrates a fundamental misunderstanding about what this debate is really all about.

Because it is not, at its essence, an environmental debate at all, but an economic one.

Governments in our own country and all over the world today are either implementing or contemplating a new tax they have never charged us for before — the emission of industrial greenhouse gases linked to climate change into the atmosphere.

It matters not whether they do it through a carbon tax or cap-and-trade, which is simply a carbon tax by another name, albeit less efficient and more open to political corruption.

What matters is that since we — all of us — are the ultimate polluters because we buy the goods and services that fossil fuel energy creates and transports, we will be the ultimate payers of what prime minister-designate Justin Trudeau vaguely refers to as “carbon pricing.”

In other words, what is actually being determined in the climate change debate is what will be our cost of living and our standard and quality of life.

Every citizen has the right to participate in that debate, without fear of being mocked or shouted down because they are not an “expert” on the science of global warming.

Which is why the dogwhistlers, with their specious comparisons of anyone who disagrees with them to Holocaust deniers and their disrespect for critical thinking, must be fought at every turn.

Wind and Solar….Nothing more than Unaffordable Novelty Energy!

Top Danish Economist Bjoern Lomborg Declares Wind And Solar Energies A “Fata Morgana” …”Powerless And Expensive”!

LomborgThe German online Die Welt here has a commentary on wind energy by Danish economist Bjorn Lomborg. The title of his guest commentary: “Wind energy, powerless and expensive“.

Hat-tip Peter H at Facebook.

Wind and sun energy are often viewed by fossil fuel critics as the go-to green energies. But careful analyses show that these energies are in reality impractical due to their haphazard supply and very poor efficiency. Most wind installations fail to reach 20% of their rated capacities; sun only provides power when it’s daytime and not cloudy. The figures that Lomborg presents are sobering, inconvenient and totally discouraging for wind and sun power proponents.

Citing the International Energy Agency, Lomborg writes so far today only 0.4% of global energy comes from wind and sun, despite the tens of billions of dollars invested in the energy sources. He adds:

Even in 2040, if all governments stick to their promises, sun and wind will cover only 2.2 percent of the world’s energy by 2040.”

Lomborg says that the reason why sun and wind will be “no decisive solution against climate change” is the energies’ inability to be effectively stored. He calls the belief that the energies are cheaper than fossil fuels a “Fata Morgana”.

The problem remains that storage technologies today are cumbersome, horrendously expensive and thus unfeasible. Wind and sun remain a luxury for the rich. Lomborg explains to readers how wind energy are dependent on subsidies, and that without them they make no sense. The Danish star economist points out that not only do wind and sun need subsidies, but now also so do fossil fuel plants so that they can remain on standby when the wind and sun go AWOL. He also says that wind and sun only save about half of the claimed CO2 emissions, and that under some circumstances they actually cause greater emissions.

$131 trillion for 1°C less warming

He writes the planned expansion of green energies by the year 2040 will cost 2.3 trillion dollars and result in only in a mere 0.o175 °C less temperature rise by the end of the century (using the climate forcing figures provided by the climate models).

That means 1°C of theoretical less warming would cost 131 trillion dollars! If there ever was a new definition for insanity, that’s it.

– See more at: http://notrickszone.com/2015/10/25/top-danish-economist-bjoern-lomborg-declares-wind-and-solar-energies-a-fata-morgana-powerless-and-expensive/#sthash.BcQQl393.SHzlouYB.dpuf

97% of Climate Scientists Do NOT Agree On AGW!

The claim of a 97% consensus on global warming does not stand up
Consensus is irrelevant in science. There are plenty of examples in history where everyone agreed and everyone was wrong

Richard Tol: ‘There is disagreement on the extent to which humans contributed to the observed warming. This is part and parcel of a healthy scientific debate.’ Photograph: Frank Augstein/AP

Dana Nuccitelli writes that I “accidentally confirm the results of last year’s 97% global warming consensus study”. Nothing could be further from the truth.

I show that the 97% consensus claim does not stand up.

At best, Nuccitelli, John Cook and colleagues may have accidentally stumbled on the right number.

Cook and co selected some 12,000 papers from the scientific literature to test whether these papers support the hypothesis that humans played a substantial role in the observed warming of the Earth. 12,000 is a strange number. The climate literature is much larger. The number of papers on the detection and attribution of climate change is much, much smaller.

Cook’s sample is not representative. Any conclusion they draw is not about “the literature” but rather about the papers they happened to find.

Most of the papers they studied are not about climate change and its causes, but many were taken as evidence nonetheless. Papers on carbon taxes naturally assume that carbon dioxide emissions cause global warming – but assumptions are not conclusions. Cook’s claim of an increasing consensus over time is entirely due to an increase of the number of irrelevant papers that Cook and co mistook for evidence.

The abstracts of the 12,000 papers were rated, twice, by 24 volunteers. Twelve rapidly dropped out, leaving an enormous task for the rest. This shows. There are patterns in the data that suggest that raters may have fallen asleep with their nose on the keyboard. In July 2013, Mr Cook claimed to have data that showed this is not the case. In May 2014, he claimed that data never existed.

The data is also ridden with error. By Cook’s own calculations, 7% of the ratings are wrong. Spot checks suggest a much larger number of errors, up to one-third.

Cook tried to validate the results by having authors rate their own papers. In almost two out of three cases, the author disagreed with Cook’s team about the message of the paper in question.

Attempts to obtain Cook’s data for independent verification have been in vain. Cook sometimes claims that the raters are interviewees who are entitled to privacy – but the raters were never asked any personal detail. At other times, Cook claims that the raters are not interviewees but interviewers.

The 97% consensus paper rests on yet another claim: the raters are incidental, it is the rated papers that matter. If you measure temperature, you make sure that your thermometers are all properly and consistently calibrated. Unfortunately, although he does have the data, Cook does not test whether the raters judge the same paper in the same way.

Consensus is irrelevant in science. There are plenty of examples in history where everyone agreed and everyone was wrong. Cook’s consensus is also irrelevant in policy. They try to show that climate change is real and human-made. It is does not follow whether and by how much greenhouse gas emissions should be reduced.

The debate on climate policy is polarised, often using discussions about climate science as a proxy. People who want to argue that climate researchers are secretive and incompetent only have to point to the 97% consensus paper.

On 29 May, the Committee on Science, Space and Technology of the US House of Representatives examined the procedures of the UN Intergovernmental Panel on Climate Change.

Having been active in the IPCC since 1994, serving in various roles in all its three working groups, most recently as a convening lead author for the fifth assessment report of working group II, my testimony to the committee briefly reiterated some of the mistakes made in the fifth assessment report but focused on the structural faults in the IPCC, notably the selection of authors and staff, the weaknesses in the review process, and the competition for attention between chapters. I highlighted that the IPCC is a natural monopoly that is largely unregulated. I recommended that its assessment reports be replaced by an assessment journal.

In an article on 2 June, Nuccitelli ignores the subject matter of the hearing, focusing instead on a brief interaction about the 97% consensus paper co-authored by… Nuccitelli. He unfortunately missed the gist of my criticism of his work.

Successive literature reviews, including the ones by the IPCC, have time and again established that there has been substantial climate change over the last one and a half centuries and that humans caused a large share of that climate change.

There is disagreement, of course, particularly on the extent to which humans contributed to the observed warming. This is part and parcel of a healthy scientific debate. There is widespread agreement, though, that climate change is real and human-made.

I believe Nuccitelli and colleagues are wrong about a number of issues. Mistakenly thinking that agreement on the basic facts of climate change would induce agreement on climate policy, Nuccitelli and colleagues tried to quantify the consensus, and failed.

In his defence, Nuccitelli argues that I do not dispute their main result. Nuccitelli fundamentally misunderstands research. Science is not a set of results. Science is a method. If the method is wrong, the results are worthless.

Nuccitelli’s pieces are two of a series of articles published in the Guardian impugning my character and my work. Nuccitelli falsely accuses me of journal shopping, a despicable practice.

The theologist Michael Rosenberger has described climate protection as a new religion, based on a fear for the apocalypse, with dogmas, heretics and inquisitors like Nuccitelli. I prefer my politics secular and my science sound.

• Richard Tol is a professor of economics at the University of Sussex

Renewable Energy is Unaffordable, Unreliable, and Not Fit for Commercial Use…

Tom Steyer: Wrong on the facts, economics and morality… And “all in for 2016.”

Guest post by David Middleton

If being green was a mental illness, this guy would be the poster child…

HOME | NEWS | POLICY | ENERGY ENVIRONMENT
Dem mega-donor all in for 2016

Billionaire environmentalist Tom Steyer plans to invest at least as aggressively in the 2016 presidential election as he did last year, when he became the biggest individual donor on either side of American politics.

[…]

Steyer is undeterred by critics who say he squandered more than $75 million of his own money supporting Democratic candidates who promised tough action on climate change — half of whom lost — during the 2014 election cycle.

The California-based former hedge fund manager, who said recently that he had quit investing “cold turkey” to focus full-time on climate change, refutes this charge of failure. He points out that last year was “an absolutely terrible” one for the Democratic Party, which lost control of the Senate to Republicans.

[…]

Steyer sees the 2016 presidential election as his greatest opportunity yet to turn more Americans into climate change activists and to pressure candidates to present detailed plans to reach his target of getting 50 percent of U.S. power from clean energy sources by 2030.

[…]

Steyer has already spent at least $5 million this campaign cycle to convince voters to pressure politicians on climate change. That’s a major investment at this early stage that puts him on pace with the biggest super-PAC donors on the Republican side.

Last week he announced a “seven-figure” advertising campaign in early-voting states, and his super-PAC NextGen Climate is investing heavily in digital technology and has opened offices in four key states: Iowa, New Hampshire, Florida and Ohio.

[…]

NextGen ran ads attacking the Koch brothers in the midterm election season, but asked whether he would do so again, Steyer said he is now less interested in negativity and more concerned about telling a positive story about why people should care about climate change.

“Their influence is gigantic,” Steyer said of the Kochs.

[…]

“They’re much bigger. They have much more money,” Steyer added. “Of course that’s important. … [But] we have to rely on the fact that the facts are on our side, the morality is on our side and the economics are on our side.

“And, you know if that weren’t true, we wouldn’t have a chance in hell.”

Hey Tom! It ain’t true…

“We have to rely on the fact that the facts are on our side”…

World Surface Temperature Index -vs- Atmospheric Carbon Dioxide Concentration since 1997 to present

The facts are:

  1. There has been no global warming since the late 20th century.
  2. The climate is far less sensitive to changes in atmospheric CO2 than the so-called consensus says it is.
  3. Your “50 by 30” delusion would not affect the Earth’s climate in any statistically significant manner.

“The economics are on our side.”

The economics are on the side of natural gas and nuclear power.

“The morality is on our side.”

WSJ_Lomborg

OPINION COMMENTARY
This Child Doesn’t Need a Solar Panel
Spending billions of dollars on climate-related aid in countries that need help with tuberculosis, malaria and malnutrition.

By BJORN LOMBORG
Oct. 21, 2015 6:36 p.m. ET

In the run-up to the 2015 U.N. Climate Change Conference in Paris from Nov. 30 to Dec. 11, rich countries and development organizations are scrambling to join the fashionable ranks of “climate aid” donors. This effectively means telling the world’s worst-off people, suffering from tuberculosis, malaria or malnutrition, that what they really need isn’t medicine, mosquito nets or micronutrients, but a solar panel. It is terrible news.

[…]

http://www.wsj.com/articles/this-chi…nel-1445466967

The morality is on your side?

The Pope Acts as a Shill for Climate Alarmists. No Regard for the Poor!

Written by PSI Staff on 21 Oct 2015

Outspoken Australian academic publishes telling new book exposing the Vatican for promoting junk science claims about man-global warming. heaven and hell The Encylical Letter of Pope Francis Laudato Si “care for our common home” was influenced by atheists, communists and green activists, claims Professor Ian Plimer, a world-renowned climate critic.

In Heaven and Hell Professor Plimer, a successful geologist and long-time critic of climate alarmists, takes Pope Francis to task, looking purely at the science rather than the theology.  Plimer shows the failure of the current Pope in his understanding of the real issues causing poverty, especially in Third World countries.

Plimer’s is a trusted voice in the heated climate debate and, as in his previous books, his new publication again shows that ‘anthropogenic global warming’ is a dangerous, ruinously expensive fiction, a ‘first-world luxury’ with no basis in scientific fact.

“The hypothesis that human activity can create global warming is extraordinary because it is contrary to validated knowledge from solar physics, astronomy, history, archaeology and geology,” says Plimer, and while his thesis is not new, you’re unlikely to have heard it expressed with quite such vigour, certitude or wide-ranging scientific authority.

Professor Plimer tells Principia Scientific International that he “hops into Naomi Klein in this book.” (Klein is a trumpeter for the alarmist movement and recently admitted that man-made climate change is not about the science). The book is on general release from October 23, 2015.

Plimer has previously warned that:

The Climate Change Authority and the Greens want more renewables because apparently, human emissions of CO2 drive global warming. I am a patient chap, was fabulously good looking in the long ago and have a dog that’s never bitten me but please, dear readers, can someone show me from basic science and mathematics that the human emissions (3% total) of plant food (CO2) drive climate change yet the 97% of natural emissions of CO2 do not. This has never been done and I’m still waiting for the proof. It’s easy to show that human emissions of CO2 don’t drive climate change and there are many scientific arguments to show that the total atmospheric CO2 does not drive climate change.

The Utterly Futile Experiment with Wind Power, is Showing Signs of Collapse.

Britain’s Insanely Expensive & Utterly Pointless Wind Power Fiasco Exposed

ICU Respiratory_therapist

****

When it comes to their demand for electricity, the power consumer has a couple of basic needs: when they hit the light switch they assume illumination will shortly follow and that when the kettle is kicked into gear it’ll be boiling soon thereafter. And the power consumer assumes that these – and similar actions in a household or business – will be open to them at any time of the night or day, every day of the year.

For conventional generators, delivering power on the basic terms outlined above is a doddle: delivering base-load power around the clock, rain, hail or shine is just good business. It’s what the customer wants and is prepared to pay for, so it makes good sense to deliver on-demand.

But for wind power generators it’s never about how much the customer wants or when they want it, it’s always and everywhere about the vagaries of the wind. When the wind speed increases to 25 m/s, turbines are automatically shut-off to protect the blades and bearings; and below 6-7 m/s turbines are incapable of producing any power at all.

It’s no wonder that the Brits have noticed that wind power is nothing more than a sick joke.

Even with the most geographically widespread grid-connected set of wind farms in the world (the 3,669 MW of wind power capacity connected to Australia’s Eastern grid across SA, Victoria, Tasmania and NSW) there are dozens of occasions each year when total wind power output struggles to top 2% of installed capacity – and hundreds when it fails to muster even 5%:

The Wind Power Fraud (in pictures): Part 1 – the South Australian Wind Farm Fiasco

The Wind Power Fraud (in pictures): Part 2 – The Whole Eastern Grid Debacle

And see our posts here and here and here.

May 2015 National

Now, if the power consumer was given advance warning of when these total output failures were going to occur, they might simply reconsider their selfish demands of having illumination after dark or that hot cuppa in the morning. That way, they might still consider wind power as some kind of “alternative” for conventional power?

But, so far, power consumers remain stubbornly selfish; wedded to the idea that when they hit the switch, their power needs will be satisfied that very instant (the cheek, hey?).

And that’s where the myth about wind power being some kind of “alternative” falls in a heap.

Unless you’re prepared to live like stone-age hermits, power delivered at the whim of mother nature (which in practical terms means no power at all, hundreds of times each year) is NO alternative for power delivered on-demand; anytime of the day or night; every single day of the year – and in volumes sufficient to satisfy all consumers connected to the same network, at the same time.

It was only a matter of time before the data (you know, the stuff that ‘inconvenient’ facts are made of) came to light and exposed the great wind power fraud for what it is: Britain, no exception.

Derek Partington has been perusing the woeful numbers over the last few years and produced the dismal results in this paper: Intermittency of UK Wind Power Generation 2013 and 2014

Derek has a degree in Physics; was formerly a Chartered Engineer and a member of both the Institute of Physics and the Institute of Measurement and Control. He worked for British Steel for 30 years and Local Government for 10 years, in both cases as a Project Manager and Business Analyst; and has been undertaking research into wind turbines for over 6 years.

Here’s the thrust of Derek’s wind industry killing paper.

Intermittency of UK Wind Power Generation 2013 and 2014
Grid, UK
Derek Partington
April 2015

Executive Summary:

This summary covers the principal findings of an analysis of electricity generation from all the UK wind turbines farms which are metered by National Grid, covering the period from January 2013 to December 2014.

The analysis shows:

Monitored wind turbine output (as measured by the National Grid) increased from 5,894MW to 8,403MW over the period.

The average capacity factor of all monitored wind turbines, onshore and offshore, across the whole of the UK, was 29.4% in 2013 and 28.8% in 2014.

The monthly average capacity factor varied from 11.1% (June 2014) to 48.8% (February 2014).

The time during which the wind turbines produced less than 10% of their rated capacity totalled 3,278 hours or 136.6 days over the two year period.

The time during which the wind turbines produced less than 5% of their rated capacity totalled 1,172 hours or 48.8 days over the same period.

Minimum wind turbine outputs averaged 132MW (1.8% of capacity) in 2013 and 174MW (2.1%) in 2014 as measured over 30 minute intervals.

Variations in output of 75 to 1 have been observed in a single month.

Maximum rise and fall in output over a one hour period was about 1000MW at the end of 2014 with a trend increase of about 250MW per year as measured over four years.

There is no correlation between UK wind turbine output and total UK electricity demand, with output often falling as demand rises and vice-versa.

The conclusions to be drawn from the analysis are that the increase in nominal capacity:

Does not increase the average wind turbine capacity factor.

Does not reduce the periods of low (less than 10% of installed capacity) or very low (less than 5%) output.

Does not reduce intermittency as measured by average monthly minimum output.

Does not reduce intermittency or variability as measured by maximum rise and fall in output over one hour period.

Does not indicate any possibility of closing any conventional, fossil-fuel power stations as there is no correlation between variations in output from wind turbines and demand on the Grid.

Therefore, based on the above, there is no case for a continued increase in the number of wind turbines connected to the Grid, or for the associated subsidies for wind energy, since this is an ineffective route to lower carbon dioxide emissions.

In April 2013 The Scientific Alliance published my analysis of electricity generation from all the UK wind turbines which are metered by National Grid, covering the period from January 2011 to December 2012.

This analysis showed:

The average capacity factor of all monitored wind turbines, both onshore and offshore, across the UK was 33.2% in 2011 and 30.7% in 2012

The average capacity factor in any given month varied from 16.2% to 50.8%.

The time during which the wind turbines produced less than 10% of their rated capacity totalled 3,165 hours and the time during which the wind turbines produced less than 5% of their rated capacity totalled 1,200 hours.

The output from wind turbines was extremely intermittent with variations by a factor of 10 occurring over very short periods.

Despite the fact that wind turbines only operate at about 30% of rated capacity on average and are exceedingly variable in their output, leading to long periods of very low output, the wind turbine fleet in the UK has increased significantly since 2012, driven entirely by government policy.

On 5 January 2015 renewableUK (the organisation representing the wind industry) headlined “Electricity needs of more than a quarter of UK homes powered by wind in 2014”.

They said that official statistics from National Grid showed that record amounts of electricity were generated by wind power in 2014:

Wind generated enough electricity to supply the needs of more than 6.7 million UK households last year; a 15% increase on the amount generated in 2013 (up from 24.5 terawatt hours to 28.1TWh in 2014) – just over 25% of all UK homes all year round.

Wind farms feeding into the grid, as well as smaller sites connected to local networks, provided 9.3% of the UK’s total electricity supply in 2014, up from 7.8% in 2013.

Other records were broken in December, with a new monthly high of 14% of all UK electricity generated by wind, beating the previous record of 13% set in December 2013, as well as a new quarterly record of 12% of electricity from wind in the last 3 months of 2014, breaking the previous record of 11% set in Q1 of 2014.

renewableUK continue to state on the Onshore Wind page of their website, “Onshore wind farms reduce CO2 emissions, provide energy security, and contribute to the local and national economy.

“The page also states, “Onshore wind works well in the UK because of the excellent wind resource. It has also become one of the most cost effective forms of renewable energy, providing over 5,000MW of capacity. A modern 2.5MW (commercial scale) turbine, on a reasonable site, will generate 6.5 million units of electricity each year – enough to make 230 million cups of tea.”

On 12 January 2015, the renewableUK home page gave figures “Powered by Wind”: Energy Produced 29,190,769 MWh, powering the equivalent of 6,963,447 homes and giving CO2 reductions (pa) of 12,552,031 tonnes.

These are very impressive figures if taken at face value, but what are the facts behind these statements – can we rely on wind turbines to power our homes and offset the annual release of carbon dioxide from conventional coal and gas burning power stations?

My previous report showed that this could only be true if the wind blew constantly but it does not, it blows very intermittently.

I have continued to analyse the output from the UK wind turbine fleet during 2013 and 2014, as measured by the electricity fed into the grid, in order to determine whether more turbines being brought into operation:

Improves average capacity factors

Reduces the periods of low or very low output

Reduces intermittency

Makes it possible to close any conventional, fossil-fuel power stations by making up for additional demand on the grid at peak times and, based on the analysis, to conclude whether wind turbines in the UK are making any significant contribution to a reduction in CO2 emissions.

Installed and Monitored Capacity

The installed capacity of wind turbines in the UK was quoted as 11,978MW by renewableUK on 12 January 2015 (7,936MW onshore and 4,042MW offshore). By comparison, on the same date the NETA (New Electricity Trading Arrangements) website quoted a capacity connected to the grid of 8,403MW, i.e. only 70% of the total installed capacity quoted by renewableUK.

This ratio has not changed over the years – at the end of 2011 the installed capacity of wind turbines in the UK was quoted as 5,772 MW whereas the monitored capacity, i.e. that monitored by the National Grid, was 4,006 MW. The equivalent figures for the end of 2012 were installed 7,777 MW, monitored 5,705 MW.

This analysis uses the NETA data throughout – the capacity connected to and monitored by the grid.

From the data on the NETA website, it is not possible to distinguish between onshore or offshore wind generation, or that from different parts of the UK. However, as this report covers the overall generation picture across the UK and does not break it down by region, this is of no consequence.

Do more wind turbines improve average output?

The average monitored capacity in 2011 was 3,340MW and the average output was 1,109.5MW giving a 33.2% capacity factor. In 2012 the equivalent figures were 4,696MW monitored by the grid, with an average output of 1,439.5MW or a capacity factor of 30.7%. The data points for each 30-minute period as monitored by the grid are averaged over the full month and a figure for output as a percentage of monitored power is calculated.

DP1

The figures show a significant variation in the average monthly capacity factor. The July average was 13.7% and that of December 46.7%. So even monthly averages vary by a factor of more than 3, a similar figure to that noted for 2011 and 2012.

DP2

Again the figures show a significant variation from month to month, the June figure being the lowest at 11.1% and February the highest at 48.8% – an increase in variation from month to month of almost 4.4 to1. Therefore from the data analysed the answer is “No, more wind turbines do not, on average, improve the average output.”

This despite there being 2.5 times increase in the installed (average) capacity from 2011 to 2014.

In fact, month to month variation, even in output averaged over the month, has increased significantly in 2014 compared with the previous three years.

If this is to be expected, simply because the installed capacity has increased, then the variation in output may be expected to increase still further as more turbines are added to the Grid, although at this stage we could equally well assume that this is primarily an artifact of the inherent variability of the wind resource.

Do more wind turbines reduce periods of low or very low output?

I have taken low output as being less than 10% of installed capacity and very low output as being less than 5% of installed capacity. Any percentage could have been chosen, but I believe that these are reasonable figures if one is to place any reliance on a sustainable source of supply.

In 2011 there were a total of 485.5 hours, or 20.2 days when output from the total UK wind turbine fleet fell to less than 5% of monitored capacity. The equivalent figures for 2012 were 714.5 hours or 29.8 days.

In 2011 there were a total of 1,370 hours, or 57.1 days when output from the total UK wind turbine fleet fell to less than 10% of monitored capacity. The equivalent figures for 2012 were 1795.5 hours or 74.8 days.

The table below gives the same data for 2013 and 2014, i.e. the total hours per month and per year where total output fell to less than 5% and less than 10% of installed capacity.

DP3

The data show no significant difference between the 2011 and 2013 periods and the 2012 and 2014 periods.

It can be seen that there are significant deviations from month to month. In the “worst” month, September 2014, the output from the total UK turbine fleet was less than 5% of their installed capacity for almost 25% of the time. In the same month the turbines failed to reach 10% of their capacity for over 62% of the time.

The graph for September 2014 is given below.

DP4

Over the 2-year period there was a total of 1,172 hours, or 48.8 days, when the output was less than 5% of nominal installed capacity.

This compares with 50 days over 2011 and 2012.

Looking at where output was less than 10% of installed capacity, for the two year period this was 3,278 hours , or 136.6 days compared with 131.9 days over 2011 and 2012.

It should be noted that 136.6 days is well over 4 months in total over the 24 month period.

Therefore from the data analysed the answer is “No, more wind turbines do not reduce periods of low or very low output”. (Note: low output is a function of natural variation in the strength of the wind – which, of course, is not influenced by having more wind turbines).

Do more wind turbines reduce intermittency?

The Oxford English Dictionary defines intermittent as “occurring at irregular intervals; not continuous or steady”. It is obvious that wind in the UK intermittent. It is not steady – sometimes the wind blows strongly, sometimes weakly and sometimes not at all. But here we are not concerned with the strength of the wind but its effect on the output of the UK wind turbine fleet.

To demonstrate the intermittency I have plotted the total UK wind turbine output for every month over the 24 months studied.

The graph on the following page shows data from a typical month, from March 2014.

It can be seen that during March 2014, the wind was always blowing somewhere in the UK as the output from all the wind turbines feeding the National Grid never fell to zero. However, the output varied dramatically from day to day, with a minimum output of 75MW and a maximum of 5,582MW – a variation of almost 75-fold.

DP5

This graph is quite typical and detailed graphs, with additional data, are given for each of the 24 months analysed in the appendix.

Intermittency can also be presented as daily minima and maxima in any month as shown in the bar chart below for August 2014. This is again a typical month where the average capacity factor was 27.5%.

DP6

On a single day, 2nd August, the variation from minimum to maximum is almost 30-fold.

The following table gives the minimum output during each month over the 2 years for which the data was analysed.

DP7

Therefore the assumption that the wind is always blowing somewhere in the UK may be true, but at times it is barely blowing enough to generate any significant energy.

In 10 out of the 24 months monitored, the minimum output dropped to 1% of capacity or less at some time. It should also be noted that the minimum output levels have not significantly changed since 2011, even with more wind turbines being installed. The equivalent average minima for 2011 and 2012 were 2.1% and 1.5% respectively.

As can be seen the maximum rise and fall has increased significantly as operational capacity has increased. This is the variation which the grid has to cope with, bringing in conventional fossil fuelled stations when output falls and taking them off line when it rises.

The above data can be plotted to give a trend showing the year on year increase.

DP8

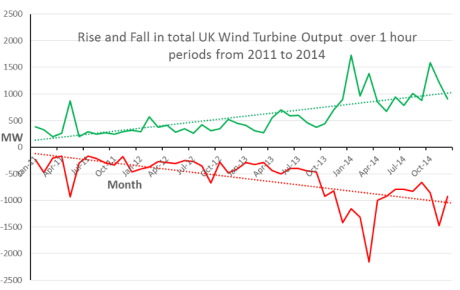
It can be seen that The National Grid is now having to cope with variations in output (intermittency) of over 1,100MW over one hour periods. It can also be seen that this variation is increasing by about 250MW per year.

It should also be noted that 1,100MW is 13% of the installed capacity and is over 40% of the average monthly output in 2014.

The peak fall over one hour was 2,153MW in March 2014, a figure which is likely to be exceeded as more turbines are connected to the grid.

Therefore, from the data analysed the answer is “No, more wind turbines do not reduce intermittency. In fact using two alternative measures, minimum output during the month and variation in output over 1 hour, then more turbines increase the impact of intermittency”.

Do more wind turbines make it possible to close any conventional, fossil-fuel power stations by making up for additional demand on the grid on peak times?

If the variation in output matched the increase or decrease in demand on the grid, then there would be no need for back-up in the form of conventional, fossil-fuel power stations.

In order to see if output from wind turbines in any way matches demand, the total output has been plotted against demand on the grid over the last seven months of 2014. In order to fit the graphs on the same scale, UK wind turbine output has been plotted alongside grid demand divided by ten.

A typical week, from October 2014, is shown below. As expected, there is no correlation between output and demand. The output varied over the week from a high of 6,000MW on 6 October to a low of 200MW on 12 October with no form of repetitive pattern in between.

DP9

The graph above does show a pattern on some days where output from wind turbines falls as demand rises and vice versa, which is not atypical. In fact over Christmas Day 2014, if wind were relied on to cook the turkey, then there would have been a public outcry as output dropped steadily from over 6,000MW on Christmas Eve to under 200MW on Boxing Day.

DP10

Therefore, from the data analysed the answer is “No, more wind turbines do not make it possible to close any conventional fossil fuel power stations”.

As expected, analysis shows that there is no correlation between variations in output from wind turbines and demand on the Grid. Often the opposite is true – when demand rises, output from wind turbines falls and vice versa. This has a significant negative effect as back-up has to be provided from conventional, fossil-fuel power stations not only to cater for increase in demand on the Grid at peak times but also to cover for any possible fall in output from the UK wind turbine fleet at the same time. (It is understood that fossil-fuel generators being run in stop-start mode to provide this back up are very inefficient and may be producing significant additional carbon dioxide than when operating in their designed steady state.) So, taking some of the renewableUK statements:

“Electricity needs of more than a quarter of UK homes powered by wind in 2014” – should this be “Electricity needs of more than a quarter of UK homes powered by wind in 2014 some of the time”?

“Wind farms feeding into the grid … provided 9.3% of the UK’s total electricity supply in 2014” – should this read “Wind farms feeding into the grid … provided 9.3% of the UK’s total electricity supply in 2014 when averaged over the year.”

“Other records were broken in December, with a new monthly high of 14% of all UK electricity generated by wind” – should this be counterbalanced by “but in June 2014 electricity generated by wind was only one quarter of this figure”.

“Onshore wind farms reduce CO2 emissions, provide energy security….”. Taking the analysis in this report, and the previous one, there is no basis for this statement.

There is patently a need to provide back-up for wind turbines which are feeding into the Grid and therefore CO2 emissions may possibly be increased rather than decreased as conventional, fossil-fuel power stations have to be operated inefficiently in order to provide this back up. Similarly there is no energy security if output can fall from over 6,000MW to under 200MW over a 42 hour period as it did over Christmas 2014.

Based on the above, I would like to see evidence that any conventional power station has been able to be closed down as a result of the introduction of over 8,000MW of wind turbine capacity feeding into the National Grid. Similarly I would like to see evidence of reductions in CO2 emissions through the introduction of wind turbines where a holistic approach to meeting the demand on the Grid is taken into consideration.

Conclusions

Over the period studied, January 2013 to December 2014 inclusive, wind turbine operational capacity connected to the UK Grid has increased from 5,894MW to 8,403MW. The operational capacity in January 2011 was 2,490MW; therefore there has been an increase of almost 3.4x over the four year period.

The conclusions to be drawn from the data analysis are:

An increase in the operational capacity does not improve average output. In fact the average monthly capacity factor has fallen over the periods studied, dropping from 33.2% in 2011 to 28.8% in 2014.

An increase in the operational capacity does not reduce the periods of low or very low output as measured by the number of hours per year when output was low (less than 10% of installed capacity) or very low (less than 5% of installed capacity). There is a variation from year to year but no pattern emerges. The mean low output over the four years was 1,617 hours/year with a standard deviation of 197 hours/year and the mean very low output was 599 hours with a standard deviation of 96 hours.

An increase in the operational capacity does not reduce intermittency. If taken as a measure of intermittency, the average monthly minimum expressed as a percentage of installed capacity was 1.9% with no significant variation from year to year.

Taking maximum rise and fall in output over one hour period as a further measure of intermittency, the National Grid is now having to cope with variations in output of over 1,100MW over one hour periods, with this variation increasing by about 250MW per year.

This is very significant as it represents the changes in output which the Grid has to cope with and which has to be compensated by conventional fossil fuelled power stations.

An increase in the operational capacity does not indicate any possibility of closing any conventional, fossil-fuel power stations as there is no correlation between variations in output from wind turbines and demand on the Grid. Often the opposite is true – when demand rises, output from wind turbines falls and vice versa.

This has a significant negative effect as back-up has to be provided from conventional, fossil-fuel power stations not only to cater for increase in demand on the Grid at peak times but also to cover for any possible fall in output from the UK wind turbine fleet at the same time.

Therefore, taking the four criteria above, there is no case for a continued increase in the number of wind turbines connected to the Grid.

As stated in my previous report, it is incumbent upon the Government to ensure that the British consumer is getting value for money from industrial wind turbine installations and that they are not just paying subsidies to developers and operators (through ROCs) whilst getting nothing back in return in terms of CO2 emission reductions through the supplanting of fossil-fuelled power generation.

Based on the results of this and my previous analysis I cannot see why any policy for the continued increase in the number of wind turbines connected to the Grid can be justified.
Derek Partington

Derek’s previous paper can be found here: Intermittency of UK Wind Power Generation 2011 and 2012

turbine-2_3153749b

Public Mislead on Climate Impacts….

Public Misled on Climate Impacts
Global warming causes reduced extreme weather
By Tom Harris, International Climate Science Coalition and Dr. Tim Ball | October 18, 2015Last Updated: October 18, 2015 6:35 pm
Former U.S. Vice President Al Gore attends a session of the World Economic Forum (WEF) annual meeting in Davos, Switzerland, on Jan. 21, 2015. (Fabrice Coffrini/AFP/Getty Images)
The public is being told by politicians, bureaucrats, and activists that global warming will cause more extreme weather. Yet both the United Nations Intergovernmental Panel on Climate Change (IPCC) and the Nongovernmental International Panel on Climate Change (NIPCC) have said the exact opposite.

ADVERTISING
In 2012 the IPCC said that a relationship between global warming and wildfires, rainfall, storms, hurricanes, and other extreme weather events has not been demonstrated. In its latest assessment report (2013), IPCC scientists concluded that they had only “low confidence” that “damaging increases will occur in either drought or tropical cyclone activity” as a result of global warming.

Hoesung Lee (R), the new president of the Intergovernmental Panel on Climate Change (IPCC), speaks to French environmentalist Nicolas Hulot as he leaves the Elysee Presidential Palace in Paris on Oct. 15, 2015, after a meeting with French President François Hollande. (Eric Feferberg/AFP/Getty Images)
Hoesung Lee (R), the new president of the Intergovernmental Panel on Climate Change (IPCC), with French environmentalist Nicolas Hulot at Elysée Presidential Palace in Paris on Oct. 15, 2015, after a meeting with French President François Hollande. (Eric Feferberg/AFP/Getty Images)

The 2013 NIPCC report concluded the same, asserting, “In no case has a convincing relationship been established between warming over the past 100 years and increases in any of these extreme events.”

The NIPCC report “Summary for Policymakers” addressed drought as follows, “Observations from across the planet demonstrate droughts have not become more extreme or erratic in response to global warming. In most cases, the worst droughts in recorded meteorological history were much milder than droughts that occurred periodically during much colder times.”

That there is no trend toward increasing extreme weather is clearly evident in the data. The National Climate Data Center (NCDC) tracks state records for maximum and minimum temperature, precipitation, snowfall, and snow depth, and sometimes hail characteristics, for each of the 50 states, a total of 346 state records since the 1890s. The NCDC records reveal that no extreme weather state records have been set in 2015. Only one was set in 2014, one in 2013, one in 2012, four in 2011. By far the majority of state records were set well before late 20th century warming. For example, New York state’s extreme weather records are spread over the past century, with no recent increase. Here are New York’s records:

Maximum Temperature: 108 degrees F, 1926
Minimum Temperature: -52 degrees F, 1979
Maximum 24-Hour Precipitation: 13.57 inches, 2014
Maximum 24-Hour Snowfall: 49 inches, 1900
Maximum Snow Depth: 119 inches, 1943

Scientists understand that global warming leads to less, not more, extreme weather. The boundary between cold polar air and warmer tropical air marks the position of the polar front. Extreme storms with winter blizzards and heavy rain in spring and fall, including tornadoes and hailstorms, form along the front. The number and intensity of extreme weather events varies with the temperature difference across the front, a parameter referred to as the zonal index.

NOAA-US-State-Climate-Records

According to the climate models the IPCC holds dear, global warming will occur fastest in polar regions, thus reducing the zonal index and so also reducing extreme weather.

As documented in climate records—proxy indicators, written records, and the brief instrumental record—extreme weather events have always been with us. For example, British surveyor and explorer Peter Fidler’s “Red River District Report 1819″ notes, “The spring months have sometimes storms of wind and thunder even so early as March within these last years the Climate seems to be greatly changed the summer so backward with very little rain and even snow in winter much less than usual and the ground parched that all summer have entirely dried up …”

The Department of Water and Power (DWP) San Fernando Valley Generating Station in Sun Valley, Calif., on Dec. 11, 2008. In August, President Obama announced a major climate change plan aimed to reduce greenhouse gas emissions from the nation’s coal-burning power plants. (David McNew/Getty Images)
The Department of Water and Power (DWP) San Fernando Valley Generating Station in Sun Valley, Calif., on Dec. 11, 2008. In August, President Obama announced a major climate change plan aimed at reducing greenhouse gas emissions from the nation’s coal-burning power plants. (David McNew/Getty Images)

If governments truly want to help farmers and others “who live off the land,” they should be preparing for the far more dangerous threat to North American agriculture—cooling.

Contrary to official records, observational evidence from around the world indicates that we are in a period of cooling almost certainly caused by solar changes. This is expected to continue posing a serious threat to prairie agriculture. Canada, the breadbasket of much of the world, is especially at risk. Fifty percent of Manitoba’s crops cannot be grown with a 0.9 degree F overall temperature drop and much of Canadian agriculture is eliminated entirely by a 1.8 degrees of Fahrenheit cooling. It’s a trend made more threatening because governments, misled by decades of corrupted, predetermined science, plan only for warming.

Based on the false premise that there has been an increase in extreme weather caused by global warming, President Barack Obama wants to replace coal, America’s cheapest and most plentiful power source, with other more expensive fuels. It is of concern to all democratic nations when the world’s primary defender of freedom is bent on crippling itself in this way.

MORE:
The Climate Scare’s ‘Useful Idiots’
Pope, UN Sabotaging Development Goals With Climate Mitigation Focus
Instead of wasting money vainly trying to stop extreme weather from happening, governments should work to harden their societies to these inevitable events by burying electrical cables underground, and reinforcing buildings and other infrastructure. After all, Manhattan businesses that did not lose communications and power during Hurricane Sandy had their cables buried underground.

Yet, according to Climate Policy Initiative, of the almost $1 billion spent globally every day on climate finance, only about 7 percent of it goes to helping people adapt to climate change. This is the real climate crisis that should concern our leaders.

Dr. Tim Ball is an environmental consultant and former climatology professor at the University of Winnipeg, Manitoba. Tom Harris is executive director of the Ottawa, Canada-based International Climate Science Coalition. ICSC is not right wing (our participants come from across the political spectrum), is not funded by “big oil,” and there are no lobbyists or “shills” for industry of any sort. Tom Harris has never worked as a lobbyist or PR rep for any company or sector.

Views expressed in this article are the opinions of the author(s) and do not necessarily reflect the views of Epoch Times.

Wind Power Generation….as Fickle as the Weather!

US Wind Power Outfits Curse ‘El Niño’ for Massive & Mounting Losses

kites

****

STT has likened it to the great corporate Ponzi schemes, pointing out, just once or twice, that the wind industry is little more than the most recent and elaborate effort to fleece gullible investors, in a list that dates back to “corporate investment classics”, like the South-Sea Bubble and Dutch tulip mania.

In the wind industry, the scam is all about pitching bogus projected returns (based on overblown wind “forecasts”) (see our posts here andhere and here and here); claiming that wind turbines will run for 25 years, without the need for so much as an oil change (see our posts hereand here and here); and telling investors that massive government mandated subsidy schemes will outlast religion (see our posts here andhere and here).

In Britain, Wind Prospect Group has stopped paying dividends to its bond holders and has prevented them from cashing them in to recover their capital outlay:

Got Money in the Great Wind Power Ponzi Scheme? Then, Grab it & Get Out Now!

In Australia, one of the wind industry’s BIG players – Pacific Hydro – managed to rack up an annual loss of $700 million, last year; in circumstances where the subsidy scheme – on which its profits depend – hadn’t changed at all (see our post here).

Also in Australia, so-called ‘community wind farm’ operators have taken thousands for dupes, with wild claims about whopping profits to be had – all while ‘saving the planet’, of course:

Wind Power ‘Investors’ Cut & Run from Australia as Ponzi Scheme Implodes

At the heart of every great Ponzi scheme sits the “excuse”. Ploys, such as asking shareholders and creditors for “patience” – as the overblown, promised returns (surprise, surprise) fail to materialize.

And the scammers will happily toss up any other pitch capable of stalling those about to be fleeced, while the scheme’s organisers get ready to flee with their loot. The more scurrilous adding some gleeful touch to their pleas for ‘patience’, such as “don’t call us, we’ll call you”; or “the weather’s especially nice this time of year in [insert name of tropical paradise, with no Australian/American extradition treaty]”, say?

Over the last few months, the wind industry – facing calamitous financial results – has taken to blaming – of all things – the weather. Yep, that’s right it’s all the wind’s fault:

Australia’s Most Notorious Wind Power Outfit – Infigen – Blames $304 Million Loss on the WIND

Wind Power Ponzi Scheme Running Out of Puff

In America, US wind power outfits have taken to cursing El Niño – a naturally occurring phenomenon – that has seen winds slacken and losses mount among wind power outfits in the US. The delicious irony appears to be lost on the Neanderthals that people the wind industry, as this little article demonstrates.

El Niño Buffers US Wind Power ‘Dreams’
Wall Street Daily
Tim Maverick
21 September 2015

The National Oceanic and Atmospheric Administration (NOAA) made it official last week. The current El Niño is classified as a strong event.

An El Niño falls into the “strong” category if weekly sea surface temperatures depart from the average by more than two degrees Celsius.

In fact, this El Niño has nudged ahead of the 1997 El Niño as the strongest in the modern era!

Meteorologists believe this occurrence is actually the most potent since 1948. And it’s expected to persist through winter and into spring.

Every El Niño’s effects are different. At the moment, this one is having a surprisingly negative effect on the wind power industry in the United States.

A Little Too Quiet

You see, this occurrence of El Niño has produced the weakest winds across the United States in 40 years. Forecasters say this situation will continue and may even worsen through the spring of 2016.

This might not seem like such a big deal, at first. Wind isn’t a huge part of our country’s power generation, right? Not so fast.

Wind is no longer just a mere marginal source of power for the electric industry. According to Bloomberg New Energy Finance, wind power installations in the United States surged 800% last year. Our country is now the second largest user of wind power technology, behind only China.

Wind accounted for 4.4% of U.S. power generation in 2014. That’s up from just 1.9% five years ago. In some states, wind makes up an even larger chunk of power generation. Wind provides nearly 10% of electricity production in Texas and 7% in California.

The overall effect of these calm conditions is that electric output from U.S. wind farms fell by 6% in the first half of this year. That happened despite wind power capacity rising by 9%.

Overall, U.S. wind farms operated at only about a third of their total generating capacity in the first half of 2015.

An Ill Wind for Some Utilities

The lack of wind has had very real effects on some utilities, and also on some yieldcos.

These include the likes of NextEra Energy (NEE), NextEra Energy Partners (NEP), NRG Energy (NRG), NRG Yield (NYLD), Pattern Energy (PEGI), and even Duke Energy (DUK).

It’s a serious matter for these firms. The CEO of NRG Energy, David Crane, told analysts last month, “We never anticipated a drop-off in the wind resource as we have witnessed over the past six months.”

Even the rating agency Standard & Poor’s is weighing in. After downgrading some wind farm bonds, S&P stated, “Although our current expectation is that the wind resource will revert back to historical averages, at this time it is unclear when this will happen.”

It’s already been a tough 2015. Year to date, NEE is 10 % lower, PEGI fell 16.5%, DUK is down 18%, NEP fell 23%, NRG is down 31.5%, and NYLD is down a whopping 69%.

Of course, utilities have been hit by the rising interest rate expectations. But the lack of strong breezes in the United States has given a little tailwind to the downside for the wind power-related stocks.

Obviously, El Niño will eventually subside and wind patterns across the country will return to normal.

But until then, the wind power generation industry in the United States will continue to suffer. Shareholders in the wind-related yieldcos and utilities will continue to take a battering for an unknown amount of time.

Maybe they can somehow tap into the hot air generated by opponents of President Obama’s Clean Power Plan. They’re having a field day right now with the Plan’s heavy reliance on fickle breezes.

Good investing, Tim Maverick
Wall Street Daily

June 2015 National

It’s a ‘fickle’ thing; to be sure. The picture above tells the woeful – weather driven – story of the performance during June 2015 of all wind farms connected to Australia’s Eastern Grid: with a combined capacity of 3,669MW – spanning 4 States and a geographical expanse of 632,755 km² – an area which is 2.75 times the combined area of England (130,395 km²) Scotland (78,387 km²) and Wales (20,761 km²) of 229,543 km². ‘Impressive’, don’t you think?

However, for the wind industry to air its dirty laundry in public demonstrates just how gormless these boys are.

You see, the whole subsidy-fuelled rort runs on “belief”.

“Belief” that a wholly weather dependent power generation source can provide meaningful electricity around the clock.

Until recently, the wind industry, its parasites and spruikers have maintained the line that the “wind is always blowing somewhere” and is, therefore, able to provide baseload power; “powering” millions of homes for “free”. The more deluded among them claiming that it can do so at prices even cheaper than the cheapest of all, coal-fired power (for a trip to fantasy-land tap into the nitwits over at ruin-economy).

But, now that bankers, investors and creditors have worked out that their debts and investments are in the hands of the Wind Gods – the scammers have been forced to come clean and admit that they have just about as much control over their financial situation, as they have over the weather. Funny about that.

yacht

Government-Induced Climaphobia Based on Faulty, Inaccurate Computer Climate Models.

SEP
28

TIME TO STOP THE INSANITY OF WASTING TIME AND MONEY ON MORE CLIMATE MODELS?

Written by Dr Tim Ball, Climatologist on 28 Sep 2015

Nearly every single climate model prediction, projection or whatever else they want to call them has been wrong. Weather forecasts beyond 72 hours typically deteriorate into their error bands. The UK Met Office summer forecast was wrong again. broken computer

I have lost track of the number of times they were wrong. Apparently, the British Broadcasting Corporation had enough as they stopped using their services. They are not just marginally wrong. Invariably, the weather is the inverse of their forecast.Short, medium, and long-term climate forecasts are wrong more than 50 percent of the time so that a correct one is a no better than a random event.

Global and or regional forecasts are often equally incorrect. If there were a climate model that made even 60 percent accurate forecasts, everybody would use it. Since there is no single accurate climate model forecast, the IPCC resorts to averaging out their model forecasts as if, somehow, the errors would cancel each other out and the average of forecasts would be representative.

Short term climate forecasts no better than the Old Farmers Almanac

Climate models and their forecasts have been unmitigated failures that would cause an automatic cessation in any other enterprise. Unless, of course, it was another government funded, fiasco. Daily weather forecasts are improved from when modern forecasting began in World War I. However, even short term climate forecasts appear no better than the Old Farmers Almanac, which appeared in 1792, using moon, sun, and other astronomical and terrestrial indicators.

I have written and often spoken about the key role of the models in creating and perpetuating the catastrophic AGW mythology. People were shocked by the leaked emails from the Climatic Research Unit (CRU), but most don’t know that the actual instructions to “hide the decline” in the tree ring portion of the hockey stick graph were in the computer code. It is one reason that people translate the Garbage In, Garbage Out (GIGO) acronym as Gospel in, Gospel Out when speaking of climate models.

I am tired of the continued pretense that climate models can produce accurate forecasts in a chaotic system. Sadly, the pretense occurs on both sides of the scientific debate. The reality is the models don’t work and can’t work for many reasons, including the most fundamental; lack of data, lack of knowledge of major mechanisms, lack of knowledge of basic physical processes, lack of ability to represent physical mechanisms like turbulence in mathematical form, and lack of computer capacity.

Bob Tisdale summarized the problems in his 2013 book Climate Models Fail. It is time to stop wasting time and money and put people and computers to more important uses.The only thing that keeps people working on the models is government funding, either at weather offices or in academia. Without this funding computer modelers would not dominate the study of climate.

Without the funding, the Intergovernmental Panel on Climate Change could not exist. Many of the people involved in climate modeling were not familiar with or had no training in climatology or climate science. They were graduates of computer modeling programs looking for a challenging opportunity with large amounts of funding available and access to large computers.

The atmosphere and later the oceans fit the bill. Now they put the two together to continue the fiasco. Unfortunately, it is all at massive expense to society. Those expenses include the computers and the modeling time but worse the cost of applying the failed results to global energy and environmental issues.

Let’s stop pretending and wasting money and time. Remove that funding and nobody would spend private money to work on climate forecast models.

I used to argue that there was some small value in playing with climate models in a laboratory, with only a scientific responsibility for the accuracy, feasibility, and applicability. It is clear they do not fulfill those responsibilities. Now I realize that position was wrong. When model results are used as the sole basis for government policy, there is no value.

It is a massive cost and detriment to society, which is what the Intergovernmental Panel on Climate Change (IPCC) was specifically designed to do.The IPCC has one small value. It illustrates all the problems identified in the previous comments. Laboratory-generated climate models are manipulated outside of even basic scientific rigor in government weather offices or academia, and then become the basis of public policy through the Summary for Policymakers (SPM).

Another value of the IPCC Physical Science Basis Reports is they provide a detailed listing of why models can’t and don’t work. Too bad few read or understand them. If they did, they would realize the limitations are such that they preclude any chance of success. Just a partial examination illustrates the point.

Data

The IPCC people knew of the data limitations from the start, but it didn’t stop them building models.In 1993, Stephen Schneider, a primary player in the anthropogenic global warming hypothesis and the use of models went beyond doubt to certainty when he said,“Uncertainty about important feedback mechanisms is one reason why the ultimate goal of climate modeling – forecasting reliably the future of key variables such as temperature and rainfall patterns – is not realizable.”A February 3, 1999, US National Research Council Report said,“Deficiencies in the accuracy, quality and continuity of the records place serious limitations on the confidence that can be placed in the research results.”

To which Kevin Trenberth responded,

“It’s very clear we do not have a climate observing system….This may come as a shock to many people who assume that we do know adequately what’s going on with the climate, but we don’t.”

Two Directors of the CRU, Tom Wigley, and Phil Jones said,“Many of the uncertainties surrounding the causes of climate change will never be resolved because the necessary data are lacking.”

70% of the world is oceans and there are virtually no stations

The Poles are critical in the dynamics of driving the atmosphere and creating climate yet there are virtually no stations in 15 million km2 of the Arctic Ocean or for the 14 million km2 of Antarctica. Approximately 85% of the surface has no weather data.

The IPCC acknowledge the limitations by claiming a single station data are representative of conditions within a 1200km radius. Is that a valid assumption? I don’t think it is.

But it isn’t just lack of data at the surface. Actually, it is not data for the surface, but for a range of altitudes above the surface between 1.25 to 2 m and as researchers from Geiger (Climate Near the Ground) on show this is markedly different from actual surface temperatures as measured at the few microclimate stations that exist.

Arguably US surface stations are best, but Anthony Watts diligent study shows that only 7.9 percent of them accurate to less than 1°C. (Figure 1) To put that in perspective, in the 2001 IPCC Report Jones claimed a 0.6°C increase over 120 years was beyond a natural increase. That also underscores the fact that most of the instrumental record temperatures were measured to 0.5°C.

tball fig 1

Other basic data, including precipitation, barometric pressure, wind speed, and direction are worse than the temperature data. For example, in Africa there are only 1152 weather watch stations, which are one-eighth the World Meteorological Organization (WMO) recommended minimum density.

As I noted in an earlier paper, lack of data for all phases of water alone guarantees the failure of IPCC projections.The models attempt to simulate a three-dimensional atmosphere, but there is virtually no data above the surface.

The modelers think we are foolish enough to believe the argument that more layers in the model will solve the problem, but it doesn’t matter if you have no data.

Major Mechanisms

During my career as a climatologist, several mechanisms of weather and climate were either discovered or measured, supposedly with sufficient accuracy for application in a model. These include, El Nino/La Nina (ENSO), the Pacific Decadal Oscillation (PDO), the Atlantic Multidecadal Oscillation (AMO), the Antarctic Oscillation (AAO), the North Atlantic Oscillation (NAO), Dansgaard-Oeschger Oscillation (D-O), Madden-Julian Oscillation (MJO), Indian Ocean Dipole (IOD), among others.

Milankovitch Effect not included in IPCC models

Despite this, we are still unclear about the mechanisms associated with the Hadley Cell and the Inter-tropical Convergence Zone (ITCZ), which are essentially the entire tropical climate mechanisms. The Milankovitch Effect remains controversial and is not included in IPCC models.

The Cosmic Theory appears to provide an answer to the relationship between sunspots, global temperature, and precipitation but is similarly ignored by the IPCC.

They do not deal with the Monsoon mechanism well as they note,“In short, most AOGCMs do not simulate the spatial or intra-seasonal variation of monsoon precipitation accurately.”There is very limited knowledge of the major oceanic circulations at the surface and in the depths. There are virtually no measures of the volumes of heat transferred or how they change over time, including measures of geothermal heat.

Physical Mechanisms

The IPCC acknowledge that,“In climate research and modeling, we should recognize that we are dealing with a coupled non-linear chaotic system, and therefore that the long-term prediction of future climate states is not possible.”

That comment is sufficient to argue for cessation of the waste of time and money. Add the second and related problem identified by Essex and McKitrick in Taken By Storm and it is confirmed.

Climate research is anything but a routine application of classical theories like fluid mechanics, even though some may be tempted to think it is. It has to be regarded in the “exotic’ category of scientific problems in part because we are trying to look for scientifically meaningful structure that no one can see or has ever seen, and may not even exist.“In this regard it is crucial to bear in mind that there is no experimental set up for global climate, so all we really have are those first principles.

You can take all the measurements you want today, fill terabytes of disk space if you want, but that does not serve as an experimental apparatus. Engineering apparatus can be controlled, and those running them can make measurements of known variables over a range of controlled physically relevant conditions.

In contrast, we have only today’s climate to sample directly, provided we are clever enough to even know how to average middle realm data in a physically meaningful way to represent climate. In short, global climate is not treatable by any conventional means.”

Computer capacity

Modelers claim computers are getting better, and all they need are bigger, faster computers. It can’t make any difference, but they continue to waste money. In 2012, Cray introduced the promotionally named Gaea supercomputer (Figure 2).

It has a 1.1 petaflops capacity. FLOPS means Floating-Point Operations per Second, and peta is 1016 (or a thousand) million floating-point operations per second. Jagadish Shukla says the challenge is“We must be able to run climate models at the same resolution as weather prediction models, which may have horizontal resolutions of 3-5 km within the next 5 years. This will require computers with peak capability of about 100 petaflops.”Regardless of the computer capacity it is meaningless without data for the model.

tball fig 2

Failed Forecasts, (Predictions, Projections)

Figure 3 shows the IPCC failed forecast. They call them projections, but the public believes they are forecasts. Either way, they are consistently wrong. Notice the labels added to Hayden’s graph taken from the Summary for Policymakers. As the error range increase in the actual data the Summary claims it is improving. One of the computer models used for the IPCC forecast belongs to Environment Canada. Their forecasts are the worst of all of those averaged results used by the IPCC (Figure 4).

tball fig 3

tball fig 4

The Canadian disaster is not surprising as their one-year forecast assessment indicates. They make a one –year forecast and provide a map indicating the percentage of accuracy against the average for the period 1981-2010 (Figure 5).

tball fig 5

The Canadian average accuracy percentage is shown in the bottom left as 41.5 percent. That is the best they can achieve after some thirty years of developing the models. Other countries results are no better.

In a New Scientist report Tim Palmer, a leading climate modeller at the European Centre for Medium-Range Weather Forecasts in Reading England said:“I don’t want to undermine the IPCC, but the forecasts, especially for regional climate change, are immensely uncertain.”

The Cost – “The sum expended must be well over $100 billion”

Joanne Nova has done most research on the cost of climate research to the US government.“In total, over the last 20 years, by the end of fiscal year 2009, the US government will have poured in $32 billion for climate research—and another $36 billion for development of climate-related technologies.

These are actual dollars, obtained from government reports, and not adjusted for inflation. It does not include funding from other governments. The real total can only grow.”There is no doubt that number grew, and the world total is likely double the US amount as this commentator claims.“

However, at least I can add a reliable half-billion pounds to Joanne Nova’s $79 billion – plus we know already that the EU Framework 7 programme includes €1.9 billion on direct climate change research. Framework 6 runs to €769 million. If we take all the Annex 1 countries, the sum expended must be well over $100 billion.”These are just the computer modeling costs.

The economic and social costs are much higher and virtually impossible to calculate.

As Paul Driessen explains“As with its polar counterparts, 90% of the titanic climate funding iceberg is invisible to most citizens, businessmen and politicians.”It’s no wonder Larry Bell can say,“The U.S. Government Accounting Office (GAO) can’t figure out what benefits taxpayers are getting from the many billions of dollars spent each year on policies that are purportedly aimed at addressing climate change.”

If it is impossible for a supposedly sophisticated agency like US GAO to determine the costs, then there is no hope for a global assessment. There is little doubt the direct cost is measured in trillions of dollars. That does not include the lost opportunities for development and lives continuing in poverty.

All this because of the falsified results from completely failed computer model prediction, projections or whatever they want to call them.It is time to stop the insanity, which in climate science is the repetition of creating computer models that don’t and can’t work? I think so.“Those who have knowledge don’t predict. Those who do predict don’t have knowledge.” Tzu, Lao (6th Century BC)

See Dr Ball’s website here:drtimball.com

Dr Tim F Ball:

B.A., (Honours), Gold Medal Winner, University of Winnipeg, 1970

M.A., University of Manitoba, 1971

Ph.D. (Doctor of Science), Queen Mary College, University of London (England), 1982Career

1996 to Now – Environmentalist, Public Speaker, Consultant, Author, columnist.

1988-96 Professor, University of Winnipeg

1984-88 Associate Professor, University of Winnipeg

1982-84 Assistant Professor, University of Winnipeg

1977-78 Acting Dean of Students

1972-82 Lecturer, Department of Geography, University of Winnipeg

1971-72 Instructor, Geography Department, University of Winnipeg

Dr Ball has authored more than 80 significant publications.

See list here:

http://drtimball.com/_files/dr-tim-ball-CV.pdf

Lefty Pope Getting Involved in the Climate Scam….Who’d Have Ever Thought?

THE CLIMATE HAS BEEN CHANGING SINCE GENESIS 1:1, SO WHY IS POPE FRANCIS SUDDENLY SO CONCERNED?
By Gene J. Koprowski on 9.21.15
Rep. Paul Gosar (R-Ariz.) tells Townhall.com that he is planning to boycott the Congressional address of Pope Francis this week. The reason? The Congressman is concerned that the speech is going to be completely politically correct, not traditionally Christian in focus. He also is outraged that the secular progressives at U.S. Environmental Protection Agency (EPA) helped co-write His Holiness’ environmental encyclical earlier this year, and does not want to offer even tacit support for that ideological document.

“Media reports indicate His Holiness instead intends to focus the brunt of his speech on climate change–a climate that has been changing since first created in Genesis. More troubling is the fact that this climate change talk has adopted all of the socialist talking points, wrapped false science and ideology into climate justice and is being presented to guilt people into leftist policies. If the Pope stuck to standard Christian theology, I would be the first in line,” wrote Rep. Gosar. “If the Pope spoke out with moral authority against violent Islam, I would be there cheering him on. If the Pope urged the Western nations to rescue persecuted Christians in the Middle East, I would back him wholeheartedly. But when the Pope chooses to act and talk like a leftist politician, then he can expect to be treated like one. Artist and columnist Maureen Mullarkey effectively communicated this fallacy stating, ‘When papal preferences, masked in a Christian idiom, align themselves with ideological agendas (e.g. radical environmentalism) [they] impinge on democratic freedoms and the sanctity of the individual.’”
Concluded the Congressman, “the earth’s climate has been changing since God created it, with or without man. On that, we should all agree. In Pope Francis’ encyclical on the environment (written with the consultation of that great seminary the EPA and its embattled head Gina McCarthy), he condemned anyone skeptical of the link between human activity and climate change and adopted the false science being propagated by the Left. If the Pope wants to devote his life to fighting climate change then he can do so in his personal time. But to promote questionable science as Catholic dogma is ridiculous.”