This is a debut article by Athelstan, a moniker long term readers of this blog may read through as they might recognise his fist. He goes by a few names but for me he’ll always be Sulla, one of my comrades in a campaign a number of years back – yeah, the Skeptocats! You get fair warning now, it’ll probably offend a number of your sensitivities but that’s what a plurality of viewpoint is all about. Pointman —-<0>— “In a time of universal deceit, telling the truth is a revolutionary act” – George Orwell It came to my attention recently, when I learnt of some quite astonishing statistics. Just a few characters you understand but whence they denoted such a drastic alteration and which were mind-boggling. Discombobulated, I will ever remain, because there is no going back. Absolute, there can be no rectification and it was all very deliberately done and in saying that, with a maleficent glee. Oh yes, they knew what they were doing, the problem is, like all insane schemes, the consequences will trigger a catastrophe. You see, it cannot just be me, have you noticed how government’s love to clarion favourable statistics? Glory, when good news, nice events occur, like a heavy cavalry charge do the politicians clamour, battle and stampede to attach their names and political parties to propitious circumstance. Glad tidings, be they sporting victories or, in the UK – royal occasions and of course: good news statistics…. . Conversely, when the figures do not suit [the politicians – TPTB] they are hidden, stowed or dripped out in piecemeal fashion. Furthermore, and by mixing incongruent or, shoving in unnecessary comparisons, graphs, alignment, using all sorts of creative accountancy and jiggery-pokery, the effects of pure statistics are blunted to dampen their immediate impact. Clever it all is, some would say it’s too bloody clever by half. Clever or machination? For the world is full of experts. Colleges, universities pump ’em out and God knows kids with totally useless degrees in psychology and social studies, joint degrees with sports-economics become instant experts pontificating on all manner of stuff which is way above their intellectual capacity to fully comprehend. Ah but no one ever really challenges these ‘experts’ because we live in a ‘virtual’ world which revolves only because of BS blurb. All of which is begging the question, before – what did we ever do without all the consultants and spin doctors? Well I’m pretty sure that the world kept turning. We all live in a world and whether you like it or not, people, everybody is bombarded by a blizzard of useless information. A plethora of numbers, words and electronic noise, which is interpreted for us in the media, by politicians and by experts who in all truth don’t know Jack about the price, quality or length of a piece of string. Though, it is hard to divine sometimes just who if anybody is actually listening, for sure the UK youth either they are incapable [probably] or, too involved in other pursuits [weren’t we all] to blumin well care. So, people half listen, are oblivious, careless and anyway, “they never tell us the truth”, well – indeed they won’t and don’t dare to and just don’t and we are led a merry dance to a tune no one recognizes but the music is incessant and the title is, “UNIVERSAL DECEIT”. On a theme and in continuation. “Political language… is designed to make lies sound truthful and murder respectable, and to give an appearance of solidity to pure wind” – George Orwell. Now, I cannot resist the urge to run you by some three rather egregious examples which are the very transubstantiation of man-made lies made manifest. Readers of this ere blog may care to remind me of the great global warming swindleand here I shall not tarry for too long with it. Though, sufficed to say this great fraud is bleeding the western taxpayer and economies dry, it makes €$£billionaires for a few and causes misery for billions and guess what? Yessiree! it’s all based on a few very dodgy statistics and some fearful tampering of the temperature record, though it’s true, as scams go even the scum who ran Ponzi Enron and Bernie Madoff would be impressed. Next, qualitative easing (QE) or put another way ‘printing money’ is another. Surely, as lies, damned lies and statistics go, QE is right up there and makes lots of money for those who can take advantage and for those who haven’t by diluting, actually debasing would be a better descriptor of the currency, it just makes you poorer, ask the chancellor of the Exchequer one called George Osborne……. silly me! Because, not even George understands it [no surprise there then]. Figures, deceits and liars. For global warming all of it, is based on dodgy stats, with QE except creating asset bubbles nobody really knows what it’s true effects are. With my final example – because the figures are explosive they are very much kept under wraps. Time was, and here I am particularly referring to the UK and wherever you may live, I would deem that you may see a slight mirror but maybe not as far gone as Britain. Time was when you could more or less rely on your local bank manager, your headmaster, the town hall clerk, the policeman and even politicians, local was best because you used to meet them day in and day out. These days, with Banking done in Bangalore, the police have retreated from the streets, town halls are glass fronted Lubyankas and with even less chance than the FSB-KGB of answering a FOI. Politicians answer, in descending order from at the top; supranational bodies – the UN, Brussels – the EU, political party, the executive, not even on the list are, “we the people”. Things, edicts, diktats are sent down from on high and our “we the people” job is to simply obey, there is no choice only the choice set before you and by all the Gods – will ye sup and eat it. So, we come to the final set of numbers, ere the census was sent out in the early part of the decade and by six months later all of the collated data was made freely available to all those who were interested – which in times past was not very many. Britain, was a nation of 48 million souls just after WWII and until the late Seventies Britain’s population had changed little since the baby boom of the Fifties and early Sixties, set at circa 55 million and which was a stable and pretty homogenous indigenous populace, those of differing skin tones numbered less than 1 million and all were fairly well assimilated into British language and culture, if not traditions, we all happily jostled and got along. Throughout the next decade things began to change, in the Eighties, immigration was rising by about 50,000/yr. Coming apart it was and then in 1997 Blair, Straw, Brown and his social engineers began their work in earnest. In 2014, last year the official figures show 583,000 came to our shores and this figure is undoubtedly an underestimate, for even the authorities believe 583,000 to be more like 783,000 ie, two hundred thousand shy of official ‘guestimates’. Though the authorities keep schtumm, it is a commonly known piece of information, the much championed process, a new system called E-borders was supposed to be rolled out in 2011/12 but it was shelved because TPTB did not want us [the British public] knowing the true extent of the figures. The Office for National Statistics (ONS), has not released the fully collated 2011 census and patently the figures now are in any direction you wend – bigger, further and faster. Anecdotal evidence, it cannot be belied and any naturalized Aussie or Kiwi who used to live here will attest to, the demographic change this country is undergoing, simply put – stupefies. For according to the 2011 UK census figures, 8,750,000 Asians [read subcontinent] now call Britain home and add in to that, 3,750,000 who identified themselves as Black or mixed race. In order, 14% and 6% added together gives you one in five, if you throw in the EU contingent 2.5 million and if you stretch the stats – foreigners account for ± 1 in 4 of the UK population. I think back to the awful days of the Balkans civil wars and think on an oft used, if only a short phrase which conjured up a dystopian blackness and horror evocative of the Nazis. Though in south-eastern Europe, it did seem, not only a world away but an inconceivable, an impossible occurence for it to arrive on these shores, in dear old Blighty. A final thought, you may remember the term, ‘ethnic cleansing’. |
corruption

Australia’s “Melissa Ware”, Attacks the Ignorance, Surrounding the Effects of Infrasound!
Pac Hydro Cape Bridgewater Wind Farm Victim – Melissa Ware – Attacks Infrasound Ignorance
May 14, 2015 by

****
Melissa Ware is one of the long-suffering victims of Pac Hydro’s Cape Bridgewater disaster.
No sooner had Melissa given Labor-in-Liberal clothing Federal MP, Disappointing Dan Tehan a solid whack – for his wind industry backed plea to salvage the completely unsustainable Large-Scale Renewable Energy Target – (see our post here), than she was back lining up another, ignoramus with this cracking letter to the Ballarat Courier.
Ill-informed opinions build on wind farm ignorance
The Courier
By Melissa Ware
5 May 2015
SENATORS and public servants, please listen to the doctors and [not] Ms Hawkins’ ill informed knowledge on wind farm health issues, and publicly remedy the ignorance without delay.
For those failing to understand simple physics and dynamics of wind turbines and resulting impacts of noise, vibration and sensation to human and animal health then you can surely understand IWEF ‘noise’ is not always ‘heard’ by the ear but by the brain. Vibrations from turbines that ripple through the ground and air, through our homes and bodies, [are] not always consciously ‘felt’, [but] are detected.
These turbine emitted noise and vibrations and sensations are torturous to many, not only in south west Victoria but around the world.
Educate yourself with some facts and figures about impacts, read Mr Cooper’s recent findings and summary of the Cape Bridgewater Wind Farm, read the submissions into the senate inquiry into wind farms: or if you can’t manage to recognise what you allow to occur in your backyard, try some empathy. Adapt.
Recognise wind farm health issues being cruelly scorned or dismissed has only one purpose, and it is not to promote good public health or well-being.
Science is purely based on a theory which is founded on fact. When new information or facts are provided then the theory is supposed to adapt accordingly.
Harmed rural people like myself tell scientists, acousticians and the medicos we are getting sick and sicker near turbines and many adversely impacted residents are prepared to assist in learning why and how we are getting sick. We are willing to open our homes and share our experiences, what we don’t need from Ms Hawkins is an accusation there is a dubious sounding, completely unbelievable ‘health scare’ campaign being undertaken by Senator Madigan.
Wind energy [is] an illusion, is illustrated and promoted as clean and safe as expected from a huge business raking in huge sums of taxpayer funding through the RECs. It is gullible believing the surface story investigate, read up on some facts or live 900m from a wind farm for six years and experience first hand the oil leaks, the chemicals, the cement, the cost, the never ending maintenance, the bombardment and the cruelty, and the utter uselessness of wind energy.
Rural people [are] forced through the inaction of the AMA and the NHMRC, and inadequate planning laws, to endure impacting emissions of wind turbines and are being prescribed the only recommendation available by GPs, and that is to ‘move away’.
Imagine, if you are able, what your response would be to the imposition of a wind farm built next door, which damages your health, which the company and the government refuse to acknowledge and you are told for your health to move away.
You can’t sell because no-one will live by choice in close proximity to these monstrosities. Senator Madigan is not the only one doing a great job in having our voices heard in parliament and seeing that this marginalisation of rural people, including my family, being adversely impacted is recognised.
Melissa Ware
Cape Bridgewater
Melissa is on very solid scientific ground, when she talks about the known, and well-established, relationship between incessant, turbine generated low-frequency and infrasound and adverse health consequences, for those constantly exposed to it.
The wind industry have known about it for over 30 years; and, in all of that time, have done precisely what you’d expect from people without a shred of empathy or human decency – they lied through their back teeth and covered it up:
Whenever they Do a “Study” on Wind Turbine Emissions, It is Never Done Properly! Science Ignored!
Massachusetts Wind Turbine Health Impact Study- Fraud, Hoax Sham,
http://patch.com/massachusetts/falmouth/bogus-mass-wind-turbine-noise-study-2012-update-0
Jeffrey M. Ellenbogen, MD; MMSc
Assistant Professor of Neurology, Harvard Medical School Division Chief, Sleep Medicine, Massachusetts General Hospital
Sheryl Grace, PhD; MS Aerospace & Mechanical Engineering Associate Professor of Mechanical Engineering, Boston University
Wendy J Heiger-Bernays, PhD
Associate Professor of Environmental Health, Department of Environmental Health, Boston University School of Public Health
Chair, Lexington Board of Health
James F. Manwell, PhD Mechanical Engineering;
MS Electrical & Computer Engineering; BA Biophysics
Professor and Director of the Wind Energy Center, Department of Mechanical & Industrial Engineering University of Massachusetts, Amherst
Dora Anne Mills, MD, MPH, FAAP
State Health Officer, Maine 1996–2011
Vice President for Clinical Affairs, University of New England
Kimberly A. Sullivan, PhD
Research Assistant Professor of Environmental Health, Department of Environmental Health, Boston University School of Public Health
Marc G. Weisskopf, ScD Epidemiology; PhD Neuroscience
Associate Professor of Environmental Health and Epidemiology Department of Environmental Health & Epidemiology, Harvard School of Public Health
Facilitative Support provided by Susan L. Santos, PhD, FOCUS GROUP Risk Communication and Environmental Management Consultants
Bogus Mass Wind Turbine Noise Study 2012 Update
Counter Points To The 2012 Massachusetts Wind Turbine Noise Study -110 Decibels Equal To A Loud Out Door Rock Band
Share CommentsBogus Mass Wind Turbine Noise Study 2012 Update
Bogus Mass Wind Turbine Noise Study 2012 Updated –May 2015
Counter Points To The Massachusetts Wind Turbine Noise Study. This study was done in 2012
Not One Victim Was Ever Interviewed or Examined
– Massachusetts has not installed a megawatt wind turbine since 2013.
First it has been found the Town of Falmouth had known three years prior to the Massachusetts DEP 2012 noise report in 2009 that the turbines being installed would produce noise levels over 110 Decibels of noise equivalent to a loud outdoor rock band .
The August 3, 2010 noise letter from Vestas wind company is at the link :
http://www.windaction.org/posts/41357-vestas-raises-concerns-about-turbine-noise-letter#.VVJlVflVikp
Since the installation of the Falmouth wind turbines the Massachusetts Clean Energy Center has admitted the turbines were placed “Ad Hoc” and now looks at setbacks over 2000 feet and has changed their noise testing procedures.
Counter Points To The Massachusetts Wind Turbine Noise Study In Which Not One Victim Was Ever Interviewed or Examined
What the Study Says: On page 1: “…It should be noted that the scope of the Panel’s effort was focused on wind turbines and is not meant to be a comparative analysis of the relative merits of wind energy vs. non-renewable fossil fuel sources such as coal, oil, and natural gas.”
However: The second paragraph of Chapter 1 of the study discusses a significant decrease in the consumption of conventional fuels and a corresponding decrease in the production of carbon dioxide and nitrogen and sulfur oxides.
The second paragraph states that reductions in the production of these pollutants will have demonstrable and positive benefits on human and environmental health
Appendix A has a 28 page summary on the origin of wind energy, the mechanics and operation of wind turbines, and the reduction of emissions if more turbines were providing energy (Section 12 is titled“Wind Turbines and Avoided Pollutants”)
On page 1: “The overall context for this study is that the use of wind turbines results in positive effects on public health and environmental health…local impacts of wind turbines, whether anticipated or demonstrated, have resulted in fewer turbines being installed than might otherwise have been expected. To the extent that these impacts can be ameliorated, it should be possible to take advantage of the indigenous wind energy resource more effectively.”
This passage indicates the true purpose of the Massachusetts study—to create an expansion of the wind industry through a slanted interpretation of wind health study documents.
The Panel merely reviewed literature and public media sources and met only three times.
Stated that sleep disruption is the most commonly reported complaint by people and discusses this primarily as a result of “unwanted sound” and audible, amplitudemodulated noise (“whooshing”)
Writes off most self-reported “annoyance” as a combination of sound, sight of the turbine, and attitude towards the wind project (ES-5)
Therefore, according to the Panel, because they “found” no negative health effects to humans as a result of their literature research, it must necessarily follow that there are positive health effects.
Yet, these positive health effects are not the result of wind turbines being safe, but that the turbines’ “green” impact on the environment will result in a decrease of conventional sources of fuel.
This endorsement of safety is an admission that the Panel failed to strictly adhere to the scope of their charge.
Expert “Independent” Panel Members:Dr. James F. Manwell and Dora Anne Mills are extreme pro-wind advocates:
Manwell oversaw the first utility scale wind turbine and the largest wind turbine constructed in Massachusetts
Manwell has won several awards from American Wind Association and U.S. Department of Energy Mills has provided public testimony and “op-ed” newspaper pieces supporting wind turbines while a member of the Commission and before the findings were released Posted information on Maine’s CDC website as Maine’s public health director that wind turbines do not have negative health effects in 2009
Page 2 of the study states that 5 of the panel members “did not have any direct experience with wind turbines.”
While the other members had backgrounds in epidemiology, toxicology , neurology, and sleep medicine, they had no past direct experience with wind turbines
Massachusetts Study Cites Sources that Contain Information that Wind Turbines Cause Negative Health Effects:
The Panel used several articles by the same authors of other studies that Senator Lasee provided to the PSC
The Panel used several articles that Senator Lasee provided to the PSC that found that infrasound from wind turbines can have negative health effects, yet the Massachusetts panel comes to different conclusions than the study authors: Ambrose, S.E. & Rand R. W., (2011, December).
The Bruce McPherson Infrasound and Low Frequency Noise Study: Adverse Health Effects Produced By Large Industrial Wind Turbines Confirmed.
http://randacoustics.com/wp-content/uploads/2011/12/The-Bruce-McPherson-ILFN- Study.pdf
http://docs.wind-watch.org/Infrasound-Measurements-Falmouth-Wind-Turbines-NCE.pdf
Infrasound Measurements of Falmouth Wind Turbines Wind #1 and Wind #2NoiseControl Engineering, LLC (NCE) – February 27, 2015 Impact on People Noise Massachusetts
This important study conducted at a home situated within 1300 feet of the Falmouth MA wind turbines identified infrasonic sound pressure levels inside the residence. These results are similar to results from other international researchers with references given in the report.
http://www.windaction.org/posts/42443-infrasound-measurements-of-falmouth-wind-turbines-wind-1-and-wind-2#.VVJmU_lViko

Counter Points To The 2012 Massachusetts Wind Turbine Noise Study -110 Decibels Equal To A Loud Out Door Rock Band
Aussie Government Windpushers, Pushing Renewable Energy Target Tax. A Form of Extortion?
Out to Save their Wind Industry Mates, Macfarlane & Hunt Lock-in $46 billion LRET Retail Power Tax
May 12, 2015 by

****
Wind industry front men, Ian “Macca” Macfarlane and, his youthful ward, young Gregory Hunt are out to defy all-comers: the Liberal’s core constituency (of conservative voters); their colleagues, Joe Hockey and Mathias Cormann; boss, Tony Abbott; and political, economic and environmental common sense – as they pump up a deal with Labor to salvage the Large-Scale Renewable Energy Target, and their mates at Infigen, Vestas & Co.
Over the last week or so, Macca’s last-ditch deal to get Labor to sign up to cut the LRET from 41,000 GWh to 33,000 GWh was hailed by economic dullards like The Australian’s Sid Maher as a “Breakthrough”, in a series of articles that included this piece of pure fantasy:
Mr Macfarlane has expressed concerns about the ability of the renewables industry to meet its RET targets after a collapse in investment in the sector. Failure to meet the target risks invoking a penalty clause that would double the cost of the scheme.
Anyone that follows these pages should spot the fiction within the fallacy; given that STT has been repeatedly pounding that kind of nonsense for some time now. And, like a dog with his favourite, well-gnawed bone, we won’t be letting go any time soon.
True, it is, that the wind industry will never meet the current target – and, as we’ve said before, it won’t meet the ‘new’ 33,000 GWh target, either. However, the claim that hitting the “penalty” will “double the cost of the scheme” is pure political twaddle; Macca knows it – and any journo who has bothered to do their homework – by reading the legislation, say, would have picked it in a heartbeat.
In short, Australia’s electricity retailers have closed ranks on wind power outfits by steadfastly refusing to enter Power Purchase Agreements, without which wind power outfits will never obtain the finance needed to build any new wind farms. The consequence being that retailers will be hit with the shortfall penalty (the ‘penalty clause’ referred to above), the full cost of which will be recovered from power consumers (a “stealth tax” that will add more than $20 billion to power bills). In addition, the cost of Renewable Energy Certificates will add a further $25 billion, taking the combined total of the REC Tax/Shortfall Charge added to retail power bills to a figure in the order of $46 billion.
At the risk of repeating ourselves (and we concede the point if challenged), in the balance of this post we’ll update our figures; and spell out just why this latest ‘deal’ is simply an effort to postpone the inevitable implosion of the most costly, and utterly pointless, Federal Government industry subsidy scheme ever devised. So, with that aside, on with the show.
The LRET is a policy debacle; it’s completely unsustainable, on every level: economic, social and political. It is not – as the likes of Macca and Hunt cynically pretend – and a gullible press naively reports – a warm and fuzzy, family and business friendly policy that won’t cost anyone a cent.
What journos like Sid Maher have either failed to appreciate – or are simply choosing to ignore – is the fact that the demise of the LRET has nothing to do with numerical targets, the death of the wind industry is a consequence of Australia’s electricity retailers’ commercially driven desire to destroy the LRET, and the wind industry along with it.
In the absence of the mandated subsidies (“the carrot”) directed to wind power outfits, and the mandated penalties (“the stick”) whacked on retailers under the LRET, there would simply be no market whatsoever for wind power (see our post here). Kill or cut the LRET, and the wind industry is completely finished – it’s mortally wounded now.
Commercial power retailers have not entered any Power Purchase Agreements (PPAs) to purchase wind power (or, rather, to obtain RECs) since November 2012. The wind industry’s demise was laid out long before the RET Review panel got to work in April 2014 and the talk about ‘dreaded uncertainty’ is just that: wind farm construction in Australia has come to a grinding halt because it makes no commercial sense to purchase power from an intermittent and wholly weather dependent generation source, that costs 3-4 times the cost of conventional power.
The shortfall charge, set by the legislation at $65 per MWh, is not a deductible business expense (the shortfall charge is treated as a “fine”), the effective pre-tax penalty is, therefore, $92.86 ($65/(1-30%), assuming a 30% marginal tax rate. In the past, we’ve used $94 as the likely trading figure for RECs (as the shortfall charge starts to bite); but, as young Gregory Hunt uses the figure of $93 – when he refers to it as “a massive penalty carbon tax” – we’re happy to knock off the buck and run the numbers again.
Retailers, like Grant King from Origin Energy, have made it known that they have no intention of entering PPAs with wind power outfits – and, instead, will simply pay the shortfall charge, collect the full cost of it from their customers (ie $93 per MWh – compared with the average wholesale price of $35 per MWh) and declare the cost of the fines on their retail power bills as a “Federal Tax on Electricity Consumers”.
The cost of the shortfall charge at $65 per MWh compares with the average wholesale power price of between $35-40 per MWh. Therefore, at a minimum, retailers will be paying $100-105 per MWh for power, once the penalty hits (the average wholesale price plus the shortfall charge).
The Australian’s top economics writer, Judith Sloan has observed that the effect of the $65 per MWh shortfall charge “will be to triple the value of RECs and drive up electricity prices to a dramatic extent”; referring to the REC price in February this year – around $34 at that time – and the effect of the tax treatment of RECs versus the shortfall charge. As Judith notes, retailers will be looking to recover $93 in respect of every shortfall penalty charge they get hit with: ie, the $65 per MWh cost of the shortfall charge and the loss of the tax benefit that would otherwise be received were they to purchase RECs.
STT has likened the scenario to a “political time bomb”, where the government of the day will be belted at the ballot box for the utterly unjustified escalation in power prices, that will inevitably result from the LRET debacle.
And that brings us to Macca and Hunt’s latest efforts to salvage the wreckage of the LRET, their mates at near-bankrupt wind power outfit, Infigen (aka Babcock and Brown) and struggling Danish fan maker, Vestas, as well as their political skins.
Macca and Hunt are driving – with a lot of ‘help’ from the wind industry plants and stooges in their offices – a pitch whereby the ultimate annual LRET target gets pulled from 41,000 GWh to 33,000 GWh per year.
The LRET target is set by s40 of the Renewable Energy (Electricity) Act 2000 (here); and it’s the annual target set under that section that Macca and Hunt are hoping to pull in a deal with Labor, that, as we go to print, also appears to need help from 6 of the 8 Senate cross-benchers.
At the present time, the total annual contribution to the LRET from eligible renewable energy generation sources is 16,000 GWh; and, because retailers have not entered PPAs with wind power outfits for nearly 2½ years – and have no apparent intention of doing so from hereon – that’s where the figure will remain.
With no new wind power capacity being added – and none likely to be added – that leaves the shortfall at 17,000 GWh, or 17,000,000 MWh (1GWh = 1,000MWh); based on Macca and Hunt’s 33,000 GWh ultimate annual target.
So, as we’ve done before, we’ll put some numbers under what Macca and Hunt’s latest, last-ditch Infigen and Vestas salvage mission means – should they succeed – for Australian power punters and their retail power bills – assuming, of course, that they aren’t already among the tens of thousands that have been chopped from the grid, because they can’t pay their power bills now (see our posts here and here); or among those whose businesses are getting slammed against the wall, due to rocketing power prices (see our posts here and here).
In the table below, the “Shortfall in MWh (millions)” is based on the current, total contribution of 16,000,000 MWh, as against the 33,000 GWh target being pitched by Macca and Hunt, set out as the “Target in MWh (millions)”.
The target currently set for 2019 is 36.4 million MWhs, but we’ll assume that gets pulled to 33 million too, under Macca and Hunt’s ‘ingenious’ Infigen and Vestas rescue plan.
A REC is issued for every MWh of eligible renewable electricity dispatched to the grid; and a shortfall penalty applies to a retailer for every MWh that they fall short of the target – the target is meant to be met by retailers purchasing and surrendering RECs. As set out below, the shortfall charge kicks in this calendar year.
As set out above, given the impact of the shortfall charge, and the tax treatment of RECs versus the shortfall charge, the full cost of the shortfall charge to retailers is also $93. Using that figure applied to the 33,000 GWh ‘deal’, we’ll start with the cost of the shortfall penalty.
| Year | Target in MWh (millions) | Shortfall in MWh (millions) | Penalty on Shortfall @ $65 per MWh | Minimum Retailers recover @ $93 |
| 2015 | 18 | 2 | $130,000,000 | $186,000,000 |
| 2016 | 22.6 | 6.6 | $429,000,000 | $613,800,000 |
| 2017 | 27.2 | 11.2 | $728,000,000 | $1,041,600,000 |
| 2018 | 31.8 | 15.8 | $1,027,000,000 | $1,469,400,000 |
| 2019 | 33 | 17 | $1,105,000,000 | $1,581,000,000 |
| 2020 | 33 | 17 | $1,105,000,000 | $1,581,000,000 |
| 2021 | 33 | 17 | $1,105,000,000 | $1,581,000,000 |
| 2022 | 33 | 17 | $1,105,000,000 | $1,581,000,000 |
| 2023 | 33 | 17 | $1,105,000,000 | $1,581,000,000 |
| 2024 | 33 | 17 | $1,105,000,000 | $1,581,000,000 |
| 2025 | 33 | 17 | $1,105,000,000 | $1,581,000,000 |
| 2026 | 33 | 17 | $1,105,000,000 | $1,581,000,000 |
| 2027 | 33 | 17 | $1,105,000,000 | $1,581,000,000 |
| 2028 | 33 | 17 | $1,105,000,000 | $1,581,000,000 |
| 2029 | 33 | 17 | $1,105,000,000 | $1,581,000,000 |
| 2030 | 33 | 17 | $1,105,000,000 | $1,581,000,000 |
| Total | 495.6 | 239.6 | $15,574,000,000 | $22,282,800,000 |
Between now and 2031, Macca and Hunt’s 33,000 GWh total target couldbe satisfied by the issue and surrender of 495,600,000 RECs. However, with only 16 million RECs available annually there will be a total shortfall of 239,600,000: only 256 million RECs will be available to satisfy the LRET’s remaining 495,600,000 MWh target, set under the ‘brilliant’ 33,000 GWh Infigen and Vestas rescue ‘plan’.
Under the latest ‘deal’, assuming that RECs hit $93, as the penalty begins to apply later this year, the total cost added to power consumers’ bills will top $46 billion (495,600,000 x $93), as set out in the table below.
Power consumers will end up paying for the shortfall penalty collected by the Federal government, and for the cost of the RECs issued to wind power outfits – in relation to collecting the cost of the REC Subsidy from power consumers, Origin Energy’s Grant King correctly puts it:
“[T]he subsidy is the REC, and the REC certificate is acquitted at the retail level and is included in the retail price of electricity”.
It’s power consumers that get lumped with the “retail price of electricity” and, therefore, the cost of the REC Subsidy paid to wind power outfits.
To give some idea of how ludicrously generous the REC Subsidy is, consider a single 3 MW turbine. If it operated 24 hours a day, 365 days a year – its owner would receive 26,280 RECs (24 x 365 x 3). Assuming, generously, a capacity factor of 35% (the cowboys from wind power outfits often wildly claim more than that) that single turbine will receive 9,198 RECs annually. At $93 per REC, that single turbine will, in 12 months, rake in $855,414 in REC Subsidy.
But wait, there’s more: that subsidy doesn’t last for a single year. Oh no. A turbine operating now will continue to receive the REC subsidy for 16 years, until 2031 – such that a single 3 MW turbine spinning today can pocket a total of $13,686,624 over the remaining life of the LRET. Not a bad little rort – considering the machine and its installation costs less than $3 million; and that being able to spear it into some dimwit’s back paddock under a landholder agreement costs a piddling $10-15,000 per year. State-sponsored theft never looked easier or more lucrative!
The REC Tax/Subsidy, including that associated with domestic solar under the original RET scheme, has already added $9 billion to Australian power bills, so far.
At the end of the day, retailers will have to recover the TOTAL cost of BOTH RECs AND the shortfall charge from Australian power consumers, via retail power bills.
And that’s the figure we’ve totted up in the right hand column in the table below – which combines the annual cost to retailers of 16 million RECs at $93 (ie $1,488,000,000) and the shortfall penalty, as it applies each year from now until 2031, at the same ultimate cost to power consumers of $93.
| Year | Target in MWh (millions) | Shortfall in MWh (millions) | Shortfall Charge Recovered by Retailers @ $93 | Total Recovered by Retailers as RECs & Shortfall Charge @ $93 |
| 2015 | 18 | 2 | $186,000,000 | $1,674,000,000 |
| 2016 | 22.6 | 6.6 | $613,800,000 | $2,101,800,000 |
| 2017 | 27.2 | 11.2 | $1,041,600,000 | $2,529,600,000 |
| 2018 | 31.8 | 15.8 | $1,469,400,000 | $2,957,400,000 |
| 2019 | 33 | 17 | $1,581,000,000 | $3,069,000,000 |
| 2020 | 33 | 17 | $1,581,000,000 | $3,069,000,000 |
| 2021 | 33 | 17 | $1,581,000,000 | $3,069,000,000 |
| 2022 | 33 | 17 | $1,581,000,000 | $3,069,000,000 |
| 2023 | 33 | 17 | $1,581,000,000 | $3,069,000,000 |
| 2024 | 33 | 17 | $1,581,000,000 | $3,069,000,000 |
| 2025 | 33 | 17 | $1,581,000,000 | $3,069,000,000 |
| 2026 | 33 | 17 | $1,581,000,000 | $3,069,000,000 |
| 2027 | 33 | 17 | $1,581,000,000 | $3,069,000,000 |
| 2028 | 33 | 17 | $1,581,000,000 | $3,069,000,000 |
| 2029 | 33 | 17 | $1,581,000,000 | $3,069,000,000 |
| 2030 | 33 | 17 | $1,581,000,000 | $3,069,000,000 |
| Total | 495.6 | 239.6 | $22,282,800,000 | $46,090,800,000 |
Under the current ultimate LRET target of 41,000 GWh, the figure tops out at $3,854,000,000 a year; and $55,178,000,000 in total, so Macca and Hunt’s BIG compromise drops the REC Tax/Shortfall Penalty impact on retail power prices by a piddling $785 million a year, or $9,087,200,000 over the life of the LRET rort.
Whether it’s RECs being generated by current (or additional) wind power generation, or the shortfall charge being applied, retailers will be recovering the combined costs of BOTH – and power consumers will not “avoid” or, as Macca’s youthful ward, Greg Hunt asserts, be “protected” from any of it under Macca and Hunt’s Infigen and Vestas rescue plan.
As our simple little exercise in arithmetic makes plain, over $46 billion will be added to all Australian power consumers’ bills; irrespective of whether Macca and Hunt are able to satisfy the desires of their mates at Infigen, Vestas & Co to carpet the country in giant fans.
Not that it matters much to Australian power consumers footing the bill, but the ONLY difference is where that $46 billion gets funnelled. In the case of the REC Tax, that gets directed as a subsidy to wind power outfits (like Infigen and Pac Hydro); in the case of the shortfall charge, that gets directed to the Federal government, and goes straight into general revenue – as we call it, a “stealth tax” – as young Greg Hunt calls it, a: “massive $93 per tonne penalty carbon tax.”
Under Macca and Hunt’s piece of energy market ‘magic’, the $46 billion cost to power consumers of the REC Tax/Shortfall Penalty is just the tip of the iceberg.
The wind power capacity that Macca and Hunt’s mates at Infigen & Co are so desperate to build (in order to keep their Ponzi scheme from collapsing, as it has with Pacific Hydro) – and which Macca and Hunt hope will satisfy their ‘new’ target – will cost at least a further $80-100 billion, in terms of extra turbines and the duplicated network costs needed to hook them up to the grid: all requiring fat returns to investors; costs and returns that can only be recouped through escalating power bills:
Ian Macfarlane, Greg Hunt & Australia’s Wind Power Debacle: is it Dumb and Dumber 2, or Liar Liar?
LRET “Stealth Tax” to Cost Australian Power Punters $30 BILLION
In the first of the posts above we looked at the additional costs of building the wind power capacity needed to avoid the shortfall penalty – including the $30 billion or so needed to build a duplicated transmission grid. That is, a network largely, if not exclusively, devoted to sending wind power output from remote, rural locations to urban population centres (where the demand is) that will only ever carry meaningful output 30-35% of the time, at best. The balance of the time, networks devoted to carrying wind power will carry nothing – for lengthy periods there will be no return on the capital cost – the lines will simply lay idle until the wind picks up.
The fact that there is no grid capacity available to take wind power from remote locations was pointed to by GE boss, Peter Cowling in this recent article, as one of the key reasons that there will be no new wind farms built in Australia:
GEreports: Can Australia now learn from any other country in how to encourage renewables?
Peter: Oh yeah, certainly. I mean, I think China’s perhaps an extreme example, but the point is that you put a firm policy in place, and you take it seriously, you unleash infrastructure bottlenecks to allow it to happen, and it will happen.
GEreports: What are Australia’s infrastructure bottlenecks?
Peter: Quite often there are concerns about grid stability if you have large numbers of renewable plants out there. You can fix all that if you really are honest about wanting to increase the level of renewables in the system. There are technical fixes to all of this.
GEreports: Can you give me an example?
Peter: Ultimately, what you might have to do is what they’ve done in Texas, which is get out there and build a new grid – big backbone powerlines – and then the wind turbines come. The problem in Australia is we look at a big windy area and say, “Oh, look, it hasn’t got any grid.” No individual developer can afford to build grid, so it doesn’t happen.
GEreports: The government should do that?
Peter: They could if they wanted to, or they could step up and put in place the mechanism to encourage someone else to do it.
Australia has stepped back from that sort of planning of the grid. The government used to own the grids, and we’re pulling back from that. And that’s fine. It’s not vital that you own it. But you do have to have a plan and send the right signals to investors that you’re serious about the plan for them to be able to risk investing. And that’s a critical question.
Let the private sector do it and I think you’d probably drive your best result, particularly in an economy like Australia. But, you do need the certainty, and the reason things have stalled in Australia is not because it’s too hard or because there’s planning issues or anything else.
It’s simply that people cannot be certain at the moment that the renewable energy target will still be binding on those liable under it, so people pull back from investing. Too risky.
Network owners have no incentive to build the whopping additional transmission capacity required to accommodate new wind power capacity; and nothing like the capacity needed to send a further 17,000 GWh into the grid to meet a 33,000 GWh target.
In many places, there are numerous wind farms planned, but the existing transmission lines are literally full to capacity. One example is the Hornsdale project north of Jamestown in South Australia, which Investec offloaded a year or so back (see our post here). The original plan was for 105, 3MW turbines (or 315MW of nameplate capacity), but the line they were targeting is only capable of taking a further 60-90MW when the wind is blowing (wind farms at Jamestown and Hallett all hook in to the same line). STT hears that the latest ‘plan’ involves 30 turbines, in recognition of the fact that the line has no room to take anything more.
Moreover, even if investors were prepared to – in a Field of Dreams, “build it and they will come” moment, of the kind suggested by GE – throw money at a duplicated grid, the returns demanded by those investors can only be recovered from retail power customers. Which is yet another reason why retailers are out to wreck the LRET and the wind industry with it.
This might sound obvious, if not a little silly: electricity retailers are NOT in the business of NOT selling power.
Adding a $46 billion electricity tax to retail power bills (the ‘modest’ figure under Macca and Hunt’s cunning Infigen and Vestas rescue plan) can only make power even less affordable to tens of thousands of households and struggling businesses, indeed whole industries, meaning fewer and fewer customers for retailers like Origin.
The strategy adopted by retailers of refusing to ‘play ball’ by signing up for PPAs will, ultimately, kill the LRET. It’s a strategy aimed at being able to sell more power, at affordable prices, to more households and businesses. It’s a strategy with a mercenary purpose; and has Hunt, Macca and their wind industry backers in a flat panic.
The continued public squabbling in Canberra over the ‘magic’ LRET number, is simply a signal that the retailers’ have already won. Once upon a time, the wind industry and its parasites used to cling to the idea that the RET “has bi-partisan support“, as a self-comforting mantra: but not anymore. And it’s the retailers that have thrown the spanner in the works.
Power retailers have no incentive to lock themselves into PPAs that run for 10-15 years (the time frame demanded by wind power outfits or, rather, the banks lending to build wind farms), at prices 3-4 times the wholesale price, where the demand for power has fallen, along with the wholesale price; and demand is unlikely to improve much from here.
Nor do they have any incentive to support a policy that will simply price their customers out of the market; leaving them sitting in their – soon to be, if not already, disconnected homes – freezing (or boiling) in the dark; or shutting the doors on power hungry enterprises, like mines and mineral processors, or manufacturing, for starters.
With the collapse in iron ore prices, Australia’s economic dream run is over.
Despite the economic punishment that’s coming, Macca and Hunt are working over-time to ensure the survival of their mates at Infigen and Vestas, via a $3 billion a year wind industry subsidy, that will simply result in further generating capacity (albeit of the kind that can only be delivered, if at all, at crazy, random intervals) – at a time when Australia has REAL power generating capacity coming out of its ears.
There is NO shortage of electricity in Australia: what there is, is a shortage of reliable and affordable power. With Macca and Hunt pulling out all-stops to throw $46 billion at a wholly weather dependent power source – that’s 3-4 times the cost of the reliable stuff – it simply begs the question: just who do these clowns pretend to represent?
It’s against that backdrop, that it’s necessary to be reminded that Hunt and Macfarlane are supposed to be on the conservative side of politics. Their fervent (and seemingly inexplicable) support for the wind industry stands in lamentable contrast with the approach being shown by the Conservatives in the UK, where David Cameron won an election promising to end all subsidies to on-shore wind power:
UK Elections: Brit’s Deliverance from its Wind Power Disaster
The US, where the ‘wind power’ states have cut their state based subsidies to wind power outfits (or are well on the path of doing so); and Republicans are out to prevent the extension of the Federal government’s PTC wind power subsidy:
2015: the Wind Industry’s ‘Annus Horribilis’; or Time to Sink the Boots In
US Republicans Line Up to Can Subsidies for Wind Power
Germany, where consumers and industry are fed up with escalating power prices:
German’s Top Daily – Bild – says Time to Chop Massive Subsidies for Wind Power
And Vesta’s home turf, Denmark, where the government’s brewing and massive legal liability to wind farm neighbours has resulted in a full-blown moratorium on planning permits for new wind farms:
Denmark Calls Halt to More Wind Farm Harm
While Hunt and Macfarlane might consider themselves smarter than the market, for power consumers – and the economy as a whole – salvation comes from the fact that power retailers do NOT have to follow the insane path set by the LRET: by refusing to sign PPAs with wind power outfits, they hopped off that commercially suicidal track nearly 2½ years ago; which has given them round one on points: markets usually win in the end – ask Australian motor manufacturers, General Motors Holden and Ford.
The fact that power consumers (read ‘voters’) will be walloped with a $46 billion electricity tax under the LRET is not so much a problem for retailers, as a brewing political nightmare for the Federal government.
That the bulk of that tax will be collected as fines by retailers, provides them with the perfect piece of political leverage. Once power punters work out that they’re being slugged with a fine that’s around 3 times the cost of the power being supplied to them (ie an additional $93 per MWh, on top of the average wholesale price of $35 per MWh), they won’t just be a little miffed, they’ll be furious.
With wind power outfits in a state of grief stricken panic and their political saviours, like Macca, and Hunt powerless to make retailers enter PPAs, retailers need only keep their nerve, keep their pens in their top pockets, and watch the whole LRET debacle implode.
Far from ‘saving’ the LRET, or avoiding the shortfall penalty, the latest ‘deal’ has simply guaranteed the demise of the former, by the certain imposition of the latter. Political punishment will follow, as night follows day.

More Proof of Harm, that Windpushers & Government Choose to Ignore!
Systematic Review 2013: Association Between Wind Turbines and Human Distress
Abstract
Background and Objectives: The proximity of wind turbines to residential areas has been associated with a higher level of complaints compared to the general population. The study objective was to search the literature investigating whether an association between wind turbines and human distress exists.
Methods: A systematic search of the following databases (EMBASE, PubMed, OvidMedline, PsycINFO, The Cochrane Library, SIGLE, and Scirus) and screening for duplication led to the identification of 154 studies. Abstract and full article reviews of these studies led to the identification of 18 studies that were eligible for inclusion as they examined the association of wind turbines and human distress published in peer-review journals in English between 2003-2013. Outcome measures, including First Author, Year of Publication, Journal Name, Country of Study, Study Design, Sample Size, Response Rate, Level of Evidence, Level of Potential Bias, and Outcome Measures of Study, were captured for all studies. After data extraction, each study was analyzed to identify the two primary outcomes: Quality of Study and Conclusion of Study Effect.
Results: All peer-reviewed studies captured in our review found an association between wind turbines and human distress. These studies had levels of evidence of four and five. Two studies showed a dose-response relationship between distance from wind turbines and distress, and none of them concluded no association.
Conclusions: In this review, we have demonstrated the presence of reasonable evidence (Level Four and Five) that an association exists between wind turbines and distress in humans. The existence of a dose-response relationship (between distance from wind turbines and distress) and the consistency of association across studies found in the scientific literature argues for the credibility of this association. Future research in this area is warranted as to whether or not a causal relationship exists.
Introduction
Unlike most industries, the global wind industry grows annually by 21% despite the recent economic challenges. Canada is the ninth largest producer of wind energy in the world with a 45-fold growth in the industry in the year 2012 relative to 2000 [1-2].
The invention of the wind turbine as an electricity generating machine dates back to 1887 by James Blyth, a Scottish academic, and it used to light his holiday home in Marykirk, Scotland[3]. Wind turbines were at first welcomed by the public as being a source of energy that is both renewable and carbon emission-free. The need to generate electrical power on a large scale was the main driver in establishing the industrial wind turbines (IWTs) [4].
Wind turbines can be located as solo wind or in groups called “Wind Farms”. In either form and for various reasons (e.g., minimizing transmission costs), wind turbines are usually positioned in close proximity to residential areas (farms, villages, towns, and cities). This proximity to residential areas has been associated with a higher level of complaints compared to the general population [5]. These complaints are coined in research conducted and articles written on the subject under different terms, such as “Extreme Annoyance”, “Wind Turbine Syndrome (WTS)”, and “Distress”, among others. In this article, the term “distress” will be used unless we are quoting other articles.
Complaints resulting from the proximity to wind turbines vary in their nature, and distress is often attributed to different mechanisms, such as noise, visual impact, sleep disturbance, infrasound, and others [5-7]. Noise is the complaint that has been studied most often, especially given that environmental noise has become one of the major public health concerns of the 21st century [8].
These complaints triggered the debate about possible mechanisms of effect. Several hypothetical mechanisms have been suggested to explain the possible link(s) between wind turbines and the reported distress; some of these hypotheses attribute distress to one or more of the following: chronic noise exposure, infrasound effect, visual impact, perceived lack of control over noise, attitudes, personality, and age [5-6].
To assess the possible effects of wind turbines on human health, different outcome measures have been suggested, including annoyance, sleep disturbance, and cortisol levels. An alternative approach to health assessment involves the subjective appraisal of health-related quality of life, a concept that measures general well-being in all domains, including physical, psychological, and social domains [8].
Although the focus on researching mechanisms of effect may very well be a good first step to identifying the cause, finding an association is a cornerstone of establishing any causality, according to Hill’s Criteria of Causality [9]. A key missing piece of the scientific literature is that of an up-to-date and thorough review that examines the possible existence of an association between wind turbine and human distress. Therefore, the objective of our study was to search the literature investigating whether or not an association between wind turbines and human distress exists.
Materials & Methods
Study design
A systematic review of the existing literature of published peer-reviewed studies investigating the association between wind turbines and human distress between January 2003 – January 2013 was undertaken. This study was conducted as a collaboration between the Northern Ontario School of Medicine (NOSM), Sudbury, and Grey Bruce Health Unit, Owen Sound, Ontario, Canada.
Eligibility criteria
Inclusion Criteria:
– Peer-reviewed studies
– Studies examining association between wind turbines and distress
– Studies published in peer-review journals
– English language
– Studies involving humans
– Studies published between January 2003 – January 2013
Exclusion Criteria:
– Non-English language reports
– Investigations reporting interim analysis that did not result in stopping the study
– Secondary and long-term update reports
– Duplicate reports
– Cost effectiveness and economic studies
– Engineering studies
– Studies involving animals
Information sources
The following bibliographic databases were searched: EMBASE, PubMed, Ovid Medline, PsycINFO and The Cochrane Library, SIGLE, and Scirus, the last two of which deal with grey literature (materials that cannot be found easily through conventional channels, such as publishers; for example, thesis, dissertations, and unpublished peer-reviewed studies). Authors who published multiple studies included in our review were also contacted to identify any additional studies.
Search
Two search approaches were taken: subject heading and keyword searching. Electronic keyword searches were conducted in EMBASE, PubMed, PsycINFO, The Cochrane Library, SIGLE, and Scirus for published peer-reviewed studies according to the study inclusion criteria. All search strategies included the same search terms and combinations ([Wind power OR wind farm OR air turbine OR wind turbine] AND [Distress OR annoyance, sleep disturbance, noise OR sound OR infrasound OR sonic OR low-frequency OR acoustic OR hear OR ear OR wind turbine syndrome]).
Appropriate subject headings and limiters were identified in consultation with the corresponding author and were used to conduct electronic searches in the following bibliographic databases: EMBASE, PsycINFO, Ovid Medline, and PubMed. In order to retrieve all relevant published studies, subject headings were exploded; select subject headings were also chosen as the major focus of the search. Searches were refined by setting a publication restriction of 2003 to current and limiting results to humans.
Study selection
Study selection was performed in three stages (Figure 1):
Stage 1: Database Search
The studies that were identified through the database subject heading search (194 studies), the keyword search (142), and other sources (13 studies) were screened for duplication, yielding 154 studies.
Stage 2: Titles and Abstract Review
Screening of the titles and abstracts of the 154 retrieved studies was conducted by one qualified reviewer (the first author) in order to exclude any obvious non-eligible studies. Of these, 40 studies were deemed eligible for inclusion in a full article review.
Stage 3: Full Article Review
Two qualified reviewers conducted a full article review of the 40 studies. This review had two goals: first, to exclude any studies of non-eligible trials; second, to extract data on specific variables for further analyses. Of the 40 studies, 18 studies were deemed eligible for inclusion in our analysis.

Data collection process
Data extraction was conducted by a qualified reviewer (the first author) during the full article review of the 18 included studies. The source of data in the individual studies was confirmed by contacting investigators who authored multiple studies included in the review, due to the aggregated weight of these studies potentially affecting our conclusion. The confirmation aimed to verify whether the data examined in the individual studies were collected from a single population and used in more than one study, or from different independent populations.
Data items
Primary Outcomes:
– Quality of Study: The quality of the study was categorized into three groups (Low, Moderate, High) (categorical variable)
– Conclusion of Study Effect: (whether the study concluded association of wind turbines with the effect on human health that was under investigation) (binary variable)
Variables (Outcome Measures of Individual Studies):
– First Author: The name of the first author (nominal variable)
– Year of Publication: The year in which the study was published (ordinal variable)
– Journal Name: The name of the publishing journal (nominal variable)
– Country of Study: The name of the country where the trial was originated (nominal variable)
– Study Design: The design of the study (nominal variable)
– Sample Size: The study sample size (continuous variable)
– Response Rate: The response rate of subjects in the study (continuous variable)
– Level of Evidence: The Level of evidence of the study (nominal variable)
– Level of Potential Bias: The level of risk of bias. Categorized into three groups according to Cochrane’s recommendations [10]. (Low risk of bias: Plausible bias unlikely to seriously alter the results; Unclear risk of bias: Plausible bias that raises some doubt about the results; High risk of bias: Plausible bias that seriously weakens confidence in the results) (categorical variable)
– Outcome Measures of Study: The outcome measure under investigation in the study (nominal variable); these outcome measures are:
– Annoyance (Sensitivity to Noise)
– Sleep disturbance
– Visual impact
– Well-being (Quality of Life/Mental Effect)
– Dose-response (description of the change in distress caused by differing distances from a wind turbine)
– Infrasound effect
– Existing background noise (comparison of stress associated with wind turbines to stress associated with road traffic noise/quiet rural environment)
– Attitude to wind turbines (whether people who complain have negative personal opinions toward wind turbines)
– Economical benefit (whether people who benefit economically from wind turbines have a decreased risk of distress)
Risk of bias in individual studies
Assessing the risk of bias of individual studies was performed at both the study level (study design, sample size, response rate, direction and magnitude of any potential bias and how it was handled, limitations, and reporting quality) and the outcome level (a cautious overall interpretation was drawn of the study’s conclusions, whether effect of human distress exists, considering the specific study’s objectives).
Summary measures and synthesis of results
After data extraction, each study was analyzed to identify the two primary outcomes: First, quality of study, taking into account the study’s principle outcome measures; all outcomes, exposures, predictors, potential confounders, and effect modifiers; how the study size was arrived at; how quantitative variables were handled in the analyses; description of all statistical methods; and how loss to follow-up and missing data were addressed. Second, conclusion of study effect as a cautious overall interpretation of the study’s conclusions, taking into account the specific study’s objectives and how well these conclusions were supported by the study results.
Risk of bias across studies
To reduce potential sampling bias (for example, the quality of study could be confounded by journal name and name of first author), the reviewers blinded themselves to the name of the journal and authors until all data on the other variables of interest were collected. To reduce potential measurement bias, the following three measures were undertaken: The data were directly entered into the database instead of using collection forms, quality assurance on all steps of data collection and management was performed, and in any case of uncertainty in deciding the quality of study, the reviewer consulted one of our senior authors to confirm the decision. Furthermore, the source of data was confirmed by contacting investigators who authored multiple studies included in the review, due to the weight their aggregated studies would have in affecting our conclusions.
Ethics approval
This study used previously published data making it exempt from institutional ethics board approval.
Results
Study selection
Figure 1 presents a flowchart depicting the study screening process. The database searches produced 154 publications. From this group, 40 publications were eligible following screening the titles and abstracts. From this group, 18 publications were eligible for inclusion after full article review. These 18 studies, shown in Table 1, consist of six original studies and 12 non-original studies (secondary analyses and literature reviews based on some of these original studies). Only the six original studies were included in the final analysis shown in Table 2. The 12 non-original studies were excluded from the analysis to minimize potential bias associated with repeated results.
This review used previously published data; therefore, there was no missing data for any of the variables of interest.
Study characteristics and risk of bias within studies
Table 1 shows data on the 18 peer-reviewed studies captured in our review, including individual study characteristics, level of potential bias, and quality of study.
Results of individual studies
Table 2 shows summary data on the six original studies’ objectives, p-values, and outcome measures.
Risk of bias across studies
One main source of potential bias across these studies was that 10 of them, listed below, were mainly based on three data sets. The first data set (SWE00) was collected in Sweden in the year 2000 in agricultural areas, the second (SWE05) was collected in different environments in Sweden 2005, and the third (NL07) was collected all over the Netherlands in 2007. This potential bias was eliminated by using only the three original studies that collected the data sets [5, 19, 25]. The rest of the 10 studies (non-original studies) were excluded from the analysis to avoid repeated results.
– Bakker [11] 2012 Science of the Total Environment (NL07)
– Pedersen [16] 2011 Noise Control Eng J (SWE00) + (SWE05) + (NL07)
– Janssen [15] 2011 Acoustical Society of America (SWE00) + (SWE05) + (NL07)
– Pedersen [18] 2010 Energy Policy (NL07)
– Pedersen [19] 2009 Acoustical Society of America (NL07)
– Pedersen [21] 2008 Journal of Environmental Psychology (SWE00) + (SWE05)
– Pedersen [22] 2008 Environ Res Lett (SWE00) + (SWE05)
– Pedersen [23] 2007 Qualitative Research in Psychology (SWE00)
– Pedersen [5] 2007 Occup Environ Med (SWE05)
– Pedersen [25] 2004 Acoustical Society of America (SWE00)
Another source of bias was that three of the studies were reviews of previous literature [6, 12, 17].
Key results
– All 18 peer-reviewed studies captured in our review found an association between wind turbines and one or more types of human distress. These studies had a level of evidence of four and five.
– None of the studies captured in our review found any association (potential publication bias).
– These studies were published in a variety of journals (representative sample).
– Two of these studies showed a dose-response relationship between distance from wind turbines and distress (Table 2).
– There is still no evidence of whether or not a causal relationship between distance from wind turbines and distress exists.
Discussion
Summary of evidence
The peer-reviewed studies we reviewed provide reasonable evidence (Levels Four and Five) that an association exists between wind turbines and distress in humans.
Two of these studies showed a dose-response relationship between distance from wind turbines and distress, and none of the 18 studies concluded no association (consistency of association). The existence of a dose-response relationship and consistency, two of the Hill’s Criteria of Causality, argues for the credibility of the association.
All the evidence comes from expert opinion, case studies, and cross-sectional studies. No higher level of evidence observational studies, namely case-control and cohort studies, were utilized to investigate the subject. For example, although Shepherd, et al’s study [14] had a sound design and was well conducted and reported, it is considered at a lower level of evidence as a cross-sectional study has an increased potential for bias of its results.
Although three of the studies [6-7, 24] suggested that low-frequency sound energy wind turbines (i.e., infrasound below 20 Hz) may directly and negatively affect health, the level of evidence for these studies is also weak (expert opinions [7, 24] and a review [6] citing these two studies).
Economic benefit found in two of the studies [15, 19] could be intuitively and prematurely viewed as a factor lowering the credibility of the complaint. However, in our opinion, compensation would have lowered the credibility of the complaint only if these people had no distress following compensation. People in the studies who benefited economically from wind turbines had a decreased risk of distress but not a complete elimination of distress. Furthermore, the fact that the level of distress could be altered with financial compensation only speaks to the existence of distress.
It is worth pointing out that no causality has been established. The distress could be due to factors other than actual noise exposure. For example, the distress experienced by the participants in the original studies may have been generated or exaggerated by exposure to negative opinions on wind turbine.
Limitations
This study has a number of limitations and sources of bias. One source of bias is the exclusion of non-English studies. For example, China is the world’s leading country in the number of wind turbines [1]. The exclusion of non-English studies might have affected the overall conclusions of our review.
Another source of bias is the fact that the reviewer could not be completely blinded to the journals’ or authors’ names. There might be a theoretical incline to give studies in high impact journals higher quality because of their reputation (potential sampling bias). Nevertheless, if this bias took place, it would have an effect on the magnitude of evidence and not on the existence of the association due to the dichotomous nature of this variable (the number of studies that speaks for an association will not change).
Publication bias could be the reason for the finding that none of the 18 peer-reviewed studies captured in our review found no association. However, potential publication bias was decreased by conducting a search in two major grey literature databases (SIGLE, and Scirus).
Generalizability
The 18 studies were published in a variety of journals, making the captured studies a representative sample, which in turn increases our results’ generalizability (external validity).
The fact that the data in two of the three mentioned data sets were collected in Sweden may decrease the external validity, but simultaneously may increase the internal validity following the above logic. Furthermore, although these data were collected from one country, it still would be a safe assumption that the people and their experience with wind turbines, on which these data were collected, are not fundamentally different from people and experiences in other countries.
Future research
Further research in the area of exposure assessment and measurement is needed. The mechanism and physiology of harm needs to be confirmed. There is a need to identify the actual risk of harm and the health outcomes in people exposed. Until research can separate out specific sets of significant factors for the exposure with higher-level evidence than is available now, our ability to mitigate the harm is limited. Possible future research could be conducting longitudinal studies, performing measurements before wind turbines and after, and observing what happens to people over time.
Conclusions
We have demonstrated in our review the presence of reasonable evidence (Levels Four and Five) supporting the existence of an association between wind turbines and distress in humans. The existence of a dose-response relationship between distance from wind turbines and distress as well as the consistency of association across studies found in the scientific literature argues for the credibility of this association. Future research in this area is warranted.
References
- The Global Wind Energy Council. Accessed: October 30, 2013: http://www.gwec.net/?s=canada.
- The Global Wind Energy Council.. (2012). Accessed: October 30, 2013:http://www.gwec.net/wp-content/uploads/2012/06/Top-10-Cumulative-Capacity-December-2012.jpg.
- University of Strathclyde Archives. Accessed: January 20, 2014:http://stratharchives.tumblr.com/post/85511105886/week-18-windmill-designed-and-built-by-james.
- Krogh C, Gillis L, Kouwen N, Aramini J: WindVOiCe, a self-reporting survey: adverse health effects, industrial wind turbines, and the need for vigilance monitoring. Bull Sci Technol Soc. 2011, 31:334-45.
- Pedersen E, Hallberg L, Waye KP: Living in the vicinity of wind turbines–a grounded theory study. Qualitative Research in Psychology. 2007, 4:49–63.
- Knopper LD, Ollson CA: Health effects and wind turbines: A review of the literature. Environ Health. 2011, 10:78. 10.1186/1476-069X-10-78
- Salt AN, Hullar TE: Responses of the ear to low frequency sounds, infrasound and wind turbines. Hear Res. 2010, 268:12-21. 10.1016/j.heares.2010.06.007
- World Health Organisation: Night noise guidelines for Europe. (2009). Accessed: October 30, 2013:http://www.euro.who.int/__data/assets/pdf_file/0017/43316/E92845.pdf.
- Hill AB: The Environment and Disease: Association or Causation?. Proc R Soc Med. 1965, 58:295-300.
- Higgins JPT, Altman DG, Sterne JAC on behalf of the Cochrane Statistical Methods Group and the Cochrane Bias Methods Group: Chapter 8: Assessing risk of bias in included studies. Cochrane Handbook for Systematic Reviews of Interventions. 2011, Version 5.1.0:Accessed: October 30, 2013:http://handbook.cochrane.org/chapter_8/8_assessing_risk_of_bias_in_included_studies.htm.
- Bakker RH, Pedersen E, van den Berg GP, Stewart RE, Lok W, Bouma J: Impact of wind turbine sound on annoyance, self-reported sleep disturbance and psychological distress. Sci Total Environ. 2012, 425:42-51. 10.1016/j.scitotenv.2012.03.005
- Hanning CD, Evans A: Wind turbine noise. BMJ. 2012, 344:e1527. 10.1136/bmj.e1527
- Nissenbaum MA, Aramini JJ, Hanning CD: Effects of industrial wind turbine noise on sleep and health. Noise Health. 2012, 14:237-43. 10.4103/1463-1741.102961
- Shepherd D, McBride D, Welch D, Dirks KN, Hill EM: Evaluating the impact of wind turbine noise on health-related quality of life. Noise Health. 2011, 13:333-9.10.4103/1463-1741.85502
- Janssen SA, Vos H, Eisses AR, Pedersen E: A comparison between exposure-response relationships for wind turbine annoyance and annoyance due to other noise sources. J Acoust Soc Am. 2011, 130:3746-53. 10.1121/1.3653984
- Pedersen E: Health aspects associated with wind turbine noise—Results from three field studies. Noise Control Eng J. 2011, 59:47-53.
- Bolin K, Bluhm G, Eriksson G, Nilsson ME: Infrasound and low frequency noise from wind turbines: Exposure and health effects. Environ Res Lett. 2011, 6:1-6. 10.1088/1748-9326/6/3/035103
- Pedersen E, van den Berg F, Bakker R, Bouma J: Can road traffic mask the sound from wind turbines? Response to wind turbine sound at different levels of road traffic. Energy Policy. 2010, 38:2520–2527. 10.1016/j.enpol.2010.01.001
- Pedersen E, van den Berg F, Bakker R, Bouma J: Response to noise from modern wind farms in The Netherlands. J Acoust Soc Am. 2009, 126:634-43. 10.1121/1.3160293
- Keith SE, Michaud DS, Bly SHP: A proposal for evaluating the potential health effects of wind turbine noise for projects under the Canadian Environmental Assessment Act. Low Freq Noise Vib Active Control. 2008, 27:253-65.
- Pedersen E, Larsman P: The impact of visual factors on noise annoyance among people living in the vicinity of wind turbines. J Environ Psychol. 2008, 28:379–89.10.1016/j.jenvp.2008.02.009
- Pedersen E, Waye KP: Wind turbines – low level noise sources interfering with restoration?. Environ Res Lett. 2008, 3:1–5.
- Pedersen E, Waye KP: Wind turbine noise, annoyance and self-reported health and well-being in different living environments. Occup Environ Med. 2007, 64:480-6.
- Leventhall HG: Low frequency noise and annoyance. Noise Health. 2004, 6:59-72.
- Pedersen E, Waye KP: Perception and annoyance due to wind turbine noise–a dose-response relationship. J Acoust Soc Am. 2004, 116:3460-70.
Infrasound, from Wind Turbines, makes Life Unbearable, and we Have Proof!
Top Acoustic Engineer – Malcolm Swinbanks – Experiences Wind Farm Infrasound Impacts, First Hand
May 11, 2015 by

****
Top Acoustic Engineer, Dr Malcolm Swinbanks has been at the forefront of investigating the impacts of infrasound and low-frequency noise for over 40 years; and has been on the wind industry’s stinky trail in Michigan since 2009.
Last month, he delivered this technically brilliant paper: “Direct Experience of Low Frequency Noise and Infrasound within a Windfarm Community” at the 6th International Meeting on Wind Turbine Noise – the conference poster is available here: M.A.Swinbanks Poster
The results and observations as to the character and nature of incessant turbine generated low-frequency noise and infrasound backs up the groundbreaking work done by Steven Cooper at Pac Hydro’s Cape Bridgewater disaster (see our post here).
In that respect, the work sits amongst fine company. However, it’s Malcolm’s own experience with turbine noise and vibration that makes his paper all the more remarkable. Here’s a few extracts that tend to knock the wind industry’s ‘nocebo’ story for six.
Summary
The author first became aware of the adverse health problems associated with infrasound many years ago in 1974, when an aero-engine manufacturer approached him to consider the problems that office personnel were experiencing close to engine test facilities. He had been conducting research into the active control of sound, and the question was posed as to whether active sound control could be used to address this problem. At that time, this research was in its infancy, and the scale of the problem clearly lay outside practical implementation. Five years later, however, the author was asked to address a related problem associated with the low-frequency noise of a 15,000SHP ground-based gas-turbine compressor installation, having a 40 foot high, 10 foot diameter exhaust stack.
This problem was of a more tractable scale, and the author and his colleagues successfully reduced the low-frequency noise of the installation by over 12dB. He subsequently was requested to address a similar installation of significantly greater size and power, again with accurately predicted results.
As a consequence of this and subsequent work, the author has gained considerable experience of the disturbing effects of low-frequency noise and infrasound. So when he first became aware of the nature of adverse health reports from windfarm residents, they were immediately recognisable as effects with which he had been familiar for as many as 35 years.
Since late 2009, the author has lived part-time within a Michigan community where windturbines have been increasingly deployed. Consequently he has had significant interaction with residents whose lives and well-being have been damaged, and moreover has experienced the associated very severe effects directly, at first hand. His resultant perspective is thus based on both detailed theoretical analysis, and extensive personal, practical experience.
Introduction
In the latter part of 2009, the intention was announced to install up to 2,800 wind turbines in Huron County, Michigan, together with adjacent regions of the Thumb of Michigan. The agricultural areas of the county are made up of 1 square mile sections, bounded by a grid of roads running north-south and east-west. The proposed wind-turbine density would amount to approximately 2-3 turbines per square mile, but in each square mile there can be typically 4 to 6 residences, usually located around the perimeter. Consequently, the requirement for adequate turbine separation would very substantially restrict the possible setbacks from residences. At that time, there existed two recently commissioned windfarms in Huron county, at Elkton (32 Vestas 80m diameter V80 turbines) and Ubly (46 GE 1.5MW 77m diameter turbines). The Elkton windfarm is in unobstructed open country, but the Ubly windfarm is in an area with significant clusters of trees, which in certain wind directions could obstruct and disrupt the low-level airflow to the turbines.
Following this announcement, the author attended an Open Meeting of the Michigan Public Services Commission, at which a number of residents spoke of the problems that they were already encountering from the windfarms, in particular the windfarm at Ubly.
This author immediately recognized these problems as relating to the characteristics of low-frequency noise and infrasound, with which he had been familiar for many years. But on subsequently visiting the windfarms, it became clear that the higher frequency audible noise levels were also unacceptable, at Ubly in particular, with up to 50dBA L10 being permitted by the ordinances. The author was astonished that any professional acoustician could possibly regard the levels as acceptable.
Following the county’s early experience the ordinances were reconsidered, so that the existing setbacks of 1000 feet, and levels of 50dBA L10, were changed for non-participating landowners to 1320 feet and 45dBA L10. But problems at Ubly were still apparent even at 1500 feet and 45dBA.
The author obtained data from one such residence, which was immediately downwind of 6 turbines located approximately in a line at distances of 1500 feet to 1.25 miles, and found that there could be significant impulsive infrasound present, even though these turbines were of modern, upwind rotor design. Under some circumstances this infrasound took the form of single pulses per blade passing interval, presumably from the nearest turbine, but sometimes up to 6 separate impulses could be detected from the turbine array.
The commissioning of further wind-turbine developments was initially hampered by the lack of high capacity transmission lines, but more recently a 5GW high voltage transmission line has been routed through the county, permitting more than adequate capacity for any intended number of windfarms and turbines. Several further windfarms, with larger 100m and even 114m diameter turbines up to 500 feet in height have now been constructed, resulting in a total of more than 320 wind-turbines installed to date.
Recently, the county has turned to reconsidering the ordinances, but as of the present date has not finalized any changes. Currently permitted wind turbine sound levels and setbacks appear to be dictated primarily by an over-riding incentive to install the requisite number of turbines per square mile.
The author has attended and commented at many public meetings, but has found that the reluctance to acknowledge adverse effects associated with low frequency and infrasound, has resulted in a situation where little traction can be gained.
Several aspects deriving from his first-hand experience will now be described in the following sections.
During the early 1980’s while working on an industrial gas turbine compressor, the author became very aware that the very low-frequency sound can quickly become imperceptible when outside in any moderate breeze. More recently, while attempting to sleep in a house 3 miles from the nearest wind-turbine of a new wind farm consisting of 35 GE 1.6 100m diameter wind turbines, the author and his wife have sometimes been kept awake by the lowfrequency rumble or infrasonic “silent thump” of the turbines.
This situation can occur when the wind has veered from a cold north wind from Canada, to a warm wind from the south blowing over cold ground. Such conditions give rise to a classic temperature inversion, and the resultant wind turbine infrasound can readily propagate for 3 miles or more.
On such occasions, the author has more than once donned outdoor clothes at 1am and gone out onto the road outside the house, clear of trees and obstructions, but in the airflow of an outside wind has been consistently unable to detect any similar subjective disturbance.
It is often argued that infrasound is more readily detectable within a residence simply because the building structure greatly attenuates the higher frequencies, but has little effect on the lower frequencies. There is an additional effect, however, that tends to be overlooked. Outside, individual ears effectively represent unshrouded pointwise microphones, equally sensitive to the full effects of airflow and true infrasound. In contrast, the conditions within a building are very different.
Pressure due to wind turbulence tends to be only locally correlated over the outside surface of the building, whereas true infrasound acts coherently over the entire structure. This gives rise to an additional spatial filtering effect, whereby the wind induced pressure distribution tends to cancel itself out, but the fully coherent very low frequency wind-turbine infrasound acts to fully reinforce itself over the entire structure.
This characteristic has been exploited for many years in the design of conformal sonar arrays – distributed pressure sensing surfaces which preferentially detect acoustic signals that are fully coherent over the surface, yet “average-out” the uncorrelated pressures due to hydrodynamic flow, yielding a significant improvement in signal-to-noise ratio.
A direct consequence of this difference between inside and outside observation is that observers visiting windfarms in the open air may quite correctly comment that they cannot hear any significant low-frequency sound. Put simply, they are not observing under the appropriate conditions. Perception within a residence, particularly in a quiet bedroom, can be entirely different.
This difference is significantly enhanced by the fact that the threshold of hearing is not a constant threshold, but is automatically raised or lowered according to the background ambient sound conditions. It is for this reason that people in urban areas, with typical ambient sound levels around 55dBA, have a naturally raised threshold and are able to tolerate additional noise of comparable level, yet this same level of noise would be completely intolerable in rural areas where ambient levels can be very much lower, not infrequently in the region of 25-30dBA.
This is one of the most important effects with respect to perception of low-frequency noise and infrasound, yet the widely cited AWEA/CANWEA Expert Health Report of 2009 (3), completely failed to indicate the consequences of this process of automatic threshold adjustment.
First Hand Experience of the Severe Adverse Effects of Infrasound.
Approximately 18 months ago, the author was asked by a family living near the Ubly windturbines to help set up instrumentation and assess acoustic conditions within their basement, which is partially underground, where they hoped to encounter more tolerable sleeping conditions.
In the early evening, the author arrived at the site. It was a beautiful evening, with very little wind at ground level, but the turbines were operating. Within the house, however, it was impossible to hear any noise from the turbines and it became necessary to go outside from time-to-time to confirm that they were indeed running.
The author did not expect to obtain any significant measurements under these conditions, but nevertheless proceeded to help set up instrumentation in the form of a B&K 4193-L-004 infrasonic microphone and several Infiltek microbarometers. Calibration of the microbarometers had previously been confirmed by performing background infrasonic measurements directly side-by-side with the precision B&K microphone. The intention was to define measurement locations, to establish instrumentation gains having appropriate headroom, and to agree and go through practice procedures so that the occupants could conduct further measurements themselves.
After a period of about one hour, which time had been spent setting up instrumentation in the basement and using a laptop computer in the kitchen, the author began to feel a significant sense of lethargy. As further time passed this progressed to difficulty in concentration accompanied by nausea, so that around the 3 hour mark, he was feeling distinctly unwell.
He thought back over the day, to remember what food he had eaten and whether he might have undertaken any other action that might bring about this effect. He had light meals of cereal for breakfast and salad for lunch, so it seemed unlikely that either could have been responsible. Meanwhile, the sun was going down leaving a beautiful orange-pink glow in the sky, while ground windspeed levels remained almost zero and the evening conditions could not have been more tranquil and pleasant.
It was only after about 3.5 hours that it suddenly struck home that these symptoms were being brought about by the wind-turbines. Since there was no audible sound, and the infrasound levels appeared to be sufficiently low that the author considered them to be of little consequence, he had not hitherto given any thought to this possibility.
As further time passed, the effects increasingly worsened, so that by 5 hours he felt extremely ill. It was quite uncanny to be trying to concentrate on a computer in a very solid, completely stationary kitchen, surrounded by solid oak cabinets, with granite counter tops and a cast-iron sink, while feeling almost exactly the same symptoms as being seasick in a rough sea.
Finally, after 5 hours it was considered that enough trial runs had been taken and analysed that it was decided to set up for a long overnight run, leaving the instrumentation under the control of the home owners. The author was immensely relieved finally to be leaving the premises and able to make his way home clear of the wind turbines.
But it was by no means over. Upon getting into the car and driving out of the gateway, the author found that his balance and co-ordination were completely compromised, so that he was consistently oversteering, and the front of the car seemed to sway around like a boat at sea. It became very difficult to judge speed and distance, so that it was necessary to drive extremely slowly and with great caution.
Arriving home 40 minutes later, his wife observed immediately that he was unwell – apparently his face was completely ashen. It was a total of 5 hours after leaving the site before the symptoms finally abated.
It is often argued that such effects associated with wind turbines are due to stress or annoyance brought about by the relentless noise, but on this occasion there was no audible noise at all within the house. Moreover, it was a remarkably tranquil evening with a very impressive sunset, so any thought that problems could arise from the turbines was completely absent.
It was only once the symptoms became increasingly severe that the author finally made the connection, having first considered and ruled out any other possibilities. So explanations of “nocebo effect” would hardly appear to be appropriate, when such awareness occurred only well into the event.
In the following two figures, the typical measured infrasound levels in the basement are shown, as measured with one of the Infiltek microbarometers.

Figure 8 shows the power spectrum, measured with a nominal 0.1Hz FFT bandwidth. As can be seen, the peak of the fundamental blade rate component, at 55dB, might not normally be considered to represent a particularly obtrusive level of infrasound. Several higher harmonics of progressively reducing amplitude are visible, but this characteristic is very much as one would expect for an upwind-rotor turbine operating in comparatively smooth airflow.

The corresponding time-trace is shown in Figure 9. It can be seen that there is a single comparatively sharply defined pulse per blade-passage, so it would appear that only the closest wind-turbine is contributing significantly.
Nevertheless, it should be noted that while the fundamental harmonic of blade-passage is at only 55dB, the cumulative effect of the higher harmonics can raise the peak level of the waveform on occasion to 69-72dB. Most of the author’s prior work has concentrated on time-history analysis of the waveform, consistent with the 2004 observation by Moller & Pedersen (4) that at the very lowest frequencies it is the time-history of infrasound which is most relevant to perception. Simply observing separate spectral levels at discrete frequencies and regarding these as independent components can lead to considerable underestimate of the true levels of repetitive infrasound.
The fact that balance and coordination were found to be adversely compromised during the night drive home would suggest interference with the vestibular organs, as proposed by Pierpont (5) and subsequently by Schomer (6).
An important additional observation, however, is that the effects persisted for 5 hours afterwards, when the immediate excitation was no longer present. In contrast, for sea-sickness, effects tend to dissipate rapidly once sea conditions moderate. It is of interest that a 1984 investigation (7), in which test subjects experienced 30 minutes exposure to 8Hz excitation at very much higher levels of 130dB, reported that some adverse effects could persist for several hours later.
Conclusions
It has been shown that upwind-rotor turbines can indeed sometimes give rise to impulsive low-frequency infrasound – a characteristic commonly attributed only to old-fashioned downwind rotor configurations. But perception of wind turbine low frequency noise and infrasound can be quickly suppressed by the effects of wind-induced airflow over the ears, with the result that incorrect conclusions can easily result from observations made when exposed to outside breezy conditions.
The effects within a residence are much more readily perceptible, and cannot be ignored. An account has been given of an occurrence of severe direct health effects experienced by the author, and considered to be due entirely to wind-turbine infrasound, yet manifest under superficially benign conditions where no such adverse effects were anticipated.
MA Swinbanks
23 April 2015

Governments World-wide Have Knowingly Tortured Residents Near Wind Turbines.
Falmouth wind turbines vs Guantanamo torture techniques
How Much Sleep Deprivation Is Acceptable -None
Falmouth residents have lost sleep and property rights
The United States government used sleep deprivation in the U.S.-operated military Guantanamo Bay detention camp. Sleep deprivation is a very effective torture technique primarily used to break down the will of the detainee. Sleep deprivation causes impaired memory and cognitive functioning, decreased short term memory, speech impairment, hallucinations, psychosis, lowered immunity, headaches, high blood pressure, cardiovascular disease, stress, anxiety and depression.
Sleep deprivation is the major complaint from the wind turbine victims in Falmouth, Massachusetts and other communities with megawatt turbines placed in residential communities. Falmouth residents were made to file written certified noise complaints to the town in an effort to try and make the residents jump through hoops like a circus act in an effort to make them give up and go away.
Recently a letter dated August 3, 2010 from the manufacturer of the turbines Vestas wind company had warned the town prior to the installations of the megawatt turbines about noise. The turbines generate 110 decibels of noise or what is equal to a hard rock band playing outdoors. Falmouth officials had always known about the excessive noise yet acted like the wind turbine victims had wild imaginations and it was NIMBYism . Not In My Back Yard
Today we know how reckless Falmouth planning authorities allowed the town to site industrial-scale wind turbines in residential neighborhoods., The state and local health authorities ignored consistent reports of sleep deprivation from neighboring residents. Falmouth and other Massachusetts towns are violating fundamental human rights. Again according to the August 3, 2010 letter from Vestas town officials had known about the excessive noise long before any wind turbines were installed
Sleep deprivation at Guantanamo was authorized under the 2002 Department of Defense Memo in the form of 20 hour interrogations. The U.S. military authorized sleep deprivation for its prisoners for up to seventy two hours. Falmouth residents were subjected to two distinct types of noise 24 hours a day -7 days a week . The noise is regulatory and human annoyance or what today is called infra sound.
In 2014 no commercial megawatt turbines were built in Massachusetts despite a wind turbine renewable energy goal of 2000 megawatts of commercial wind by the year 2020.
Government agencies have admitted siting mistakes while the news media has been placed in an embarrassing position after reporting press releases from former Governor Patrick as if it was real news.
The question now whether those who ordered the wind turbines into residential neighborhoods will be held accountable.

The Hidden Agenda, Behind The Global Warming/Climate change scam!
Australia PM adviser says climate change is ‘UN-led ruse to establish new world order’
Tony Abbott’s business adviser says global warming a fallacy supported by United Nations to ‘create a new authoritarian world order under its control’

Maurice Newman, chairman of the Prime Minister’s Business Advisory Council Photo: AP
Climate change is a hoax developed as part of a secret plot by the United Nations to undermine democracies and takeover the world, a top adviser toTony Abbott, Australia’s prime minister, has warned.
Maurice Newman, the chief business adviser to the prime minister, said the science showing links between human activity and the warming climate was wrong but was being used as a “hook” by the UN to expand its global control.
“This is not about facts or logic. It’s about a new world order under the control of the UN,” he wrote in The Australian.
“It is opposed to capitalism and freedom and has made environmental catastrophism a household topic to achieve its objective.” Born in Ilford, England, and educated in Australia, Mr Newman, a staunch conservative and former chairman of the Australian Stock Exchange, has long been an outspoken critic of climate change science.
He was appointed chairman of the government’s business advisory council by Mr Abbott, who himself is something of a climate change sceptic and once famously described climate change as “absolute cr**” – a comment he later recanted.
In his comment piece – described by critics as “whacko” – Mr Newman said the world has been “subjected to extravagance from climate catastrophists for close to 50 years”.
“It’s a well-kept secret, but 95 per cent of the climate models we are told prove the link between human CO2 emissions and catastrophic global warming have been found, after nearly two decades of temperature stasis, to be in error,” he wrote.
“The real agenda is concentrated political authority. Global warming is the hook. Eco-catastrophists [ …] have captured the UN and are extremely well funded. They have a hugely powerful ally in the White House.”
Environmental groups and scientists described Mr Newman as a ‘crazed’ conspiracy theorist and some called on him to resign.
“His anti-science, fringe views are indistinguishable from those made by angry trolls on conspiracy theory forums,” said the Climate Change Council.
Professor Will Steffen, a climate change scientist, told The Australian Financial Review: “These are bizarre comments that would be funny if they did not come from [Mr Abbott’s] chief business adviser.” Mr Abbott’s office did not respond but his environment minister said he did not agree with Mr Newman’s comments.
The article was written by Mr Newman to coincide with a visit by Christiana Figueres, the UN climate change negotiation, who has urged Australia to reduce its reliance on coal. Australia is one of the world’s biggest emitters of carbon emissions per capita.
Since his election in 2013, Mr Abbott has abolished Labor’s carbon tax, scaled back renewable energy targets and appointed sceptics to several significant government positions.
Facts Like These, Put Climate Alarmists to Shame….
A Winter to Remember
In the Northeast, February 2015 was a month like no other in our lifetime; January through March Harshest since 1717?
No one who has lived in many parts of the Northeast into Canada experienced a six-week and calendar month as extreme for the combination of cold and snow as we have this late winter. From this writer’s viewpoint in southern New Hampshire, February 2015 was the coldest month ever recorded in nearby Nashua with an average temperature of 12.2 degrees Fahrenheit. It beat out January 1888, which had averaged 12.9F. A record 18 days had low temperatures at or below zero (as cold as 14F below). 25 days remained freezing or below, also a record.
Not far away in Boston, where temperature records began in 1872, February 2015 was exceeded only by February 1934, which brought Boston its all-time record of -18F. Temperatures never rose out of the 30s this year in February in Boston, though it topped 40 four times in 1934.
The cold in February 2015 was not confined to the Boston-Nashua area. It was the coldest month ever in Worcester, Hartford and Portland. It was the coldest February in Chicago and Cleveland, third coldest in New York City and fifth coldest ever in Detroit and Baltimore, both with records back into the early 1870s.
Boston set a record for monthly snow with 64.6 inches in February and 100.4 inches in the 39 days following January 24th. The 110.6 inches for the entire season exceeded the 107.6 inch record from 1995/96. The snow that year was spread out over six months with thaws, not concentrated so much in less than six weeks. The snow blitz and the intense cold is why the snow piles were so high this year. College students were shown on local television jumping out second story windows onto huge snowbanks in their bathing suit.
ONLY 1717 BEAT THIS?
Looking back through accounts of big snows in New England by the late weather historian David Ludlum, it appears for the eastern areas this winter’s snow blitz may have delivered the most snow since perhaps 1717.
That year, snows had reached five feet in December with drifts of 25 feet in January before one great last assault in late February into early March of 40 to 60 more inches. The snow was so deep that people could only leave their houses from the second floor, implying actual snow depths of as much as eight feet or more. The New England Historical Society’s account indicated New Hampshire, Massachusetts and Connecticut were hardest hit, a lot like 2015 in what was known as the year of the great snows.

“Entire houses were covered over, identifiable only by a thin curl of smoke coming out of a hole in the snow. In Hampton, N.H., search parties went out after the storms hunting for elderly people at risk of freezing to death… Sometimes they were found burning their furniture because they couldn’t get to the woodshed. People maintained tunnels and paths through the snow from house to house.”
You may hear or read that increased snow is consistent with global warming because warmer air holds more moisture. In actual fact, 93% of the years with more than 60 inches of snow in Boston were colder than normal.

During the 40 days of snowy weather this winter, we averaged over 11F below normal, and moisture content of the air in the snow region was well below the long-term average. Cooling, not warming, increases snowfall. Indeed, winter temperatures have cooled over the last two decades in the Northeast and the 10-year running mean of Boston area snowfall has skyrocketed to the highest level since snow records were first kept.

The cold continued in March here in New England. The month averaged 5.1F below in Boston and 5.8F below normal in Nashua. There were only four 50F days in March after no 40F days in February in Boston. This compares with seventeen 50F days, eleven 60F days, seven 70F days and one 80F day in March 2012.
JANUARY TO MARCH RECORD COLD
January to March average temperatures were the coldest in the entire record in Worcester, Providence, Hartford and Nashua and third coldest in Boston behind only 1885 and 1895.

In fact, it was the coldest January through March on average in the entire Northeast (the 10 Northeast states and the District of Colombia) in NOAA’s climate record, which started in 1895.

Note how from January to March temperatures in the Northeast have declined for 20 years at a rate of 1.5F/decade.

This season, most areas of central New England had the snowiest mid to late winter and many spots the snowiest winter season on record. In 2013/14, Chicago had its coldest December to March back to 1872 and third snowiest while Detroit had its snowiest back to 1880.
The Great Lakes ice in the two years was the greatest in the record back to 1973, when measurements began edging out the late 1970s, when the world was worrying about a new ice age.

The Adirondacks into southeast Canada in these years usually gets the worst of the Arctic cold. Saranac Lake in February 2015 was 13.6F below normal with 23 sub-zero days, no day reaching freezing and four record lows. March had 15 days zero or below with 10 record lows. Last March (2014), Saranac Lake was 11.4F below normal with 10 sub-zero days and seven record lows.
All of eastern Canada set all-time records for cold, and in Maritime Canada, in many locations, this winter produced more snow than any winter season on record. Charlottetown on Prince Edward Island had a record, incredible 18.1 feet of snow. These were two amazing late winters.
WHAT IS BEHIND THE EXTREMES?
I learned early in my career from the some of the giants in the field like Jerome Namias how ocean temperature pools that develop in conjunction with strong El Niño and La Niña events meander with the ocean currents determine how the jet stream sets up and how strong and persistent it is. This determines how and where extreme winters and summers are for both temperature and precipitation.
A super La Niña in 2010/11 (second strongest in 120 years by some measures) set up warm water in the central Pacific and cold water near the West Coast of North America, which lead to that record warm and droughty 2011/12 central and eastern winter, spring and summer. That warm water came east first to off of Alaska last year leading to the historic winter near the western Lakes and north-central areas (highlighted January’s so-called ‘polar vortex’). Then in 2014 the warm water was carried by the currents southeast to the entire West Coast, forcing the cold to take aim more on the eastern Lakes and Northeast that was at its worst in February.

Similar changes occurred in the Atlantic. Starting in 2007, a warm North Atlantic helped build high pressure in the polar regions and drive Siberian air west to Europe where, in December 2010, the UK had its second coldest December since 1659 in the Little Ice Age.

Though scientists had warned snow was a thing of the past, the UK and much of northern Europe had all–time record snows and cold in five of six years. The North Atlantic turned cold last year and more so this year and Europe turned milder. But a cold North Atlantic means colder and snowier winters in eastern Canada, the Great Lakes and Northeast. The Atlantic thus helped exaggerate the Pacific-driven central U.S. and Northeast cold the last two winters.
At Weatherbell.com, where we use the oceans and sun in our statistical models for long-range prediction, we successfully predicted many months in advance these historic winters. Unless we see major changes in the eastern Pacific, we expect we may make this a threepeat about the time the administration signs a treaty in Paris with other nations at the UN to disassemble our current energy policies to supposedly save the planet from the ravages of warming, which we will show you in the next story is not happening globally and hasn’t for over 18 years.
Joe D’Aleo is a certified Consulting Meteorologist, Fellow of the American Meteorological Society (AMS), former chair AMS Committee on Weather Analysis and Forecasting, co-founder and first Director of Meteorology at The Weather Channel and a former college professor of Meteorology and Climatology.
The Full Impact of the Damage, from the Wynned Fiasco, is being felt in increments. Greed Energy!
GWYN MORGAN
Special to The Globe and Mail
Published Sunday, May. 03 2015, 7:20 PM EDT
Last updated Monday, May. 04 2015, 7:31 AM EDT
Last month’s announcement by Ontario Premier Kathleen Wynne that her province would link up with the existing Quebec and California carbon dioxide cap-and-trade systems prompted an editorial in this newspaper headlined, “Is this Green Energy Act Round Two?”
Ontario’s Green Energy Act offered so-called “feed-in rates” almost four times existing electricity rates for wind and more than 10 times for solar power. Like bees to honey, wind and solar companies rushed in. By the time the government realized that these subsidies were driving Ontario from one of the lowest to one of the highest power cost jurisdictions in North America, the province had signed myriad 20-year-locked-in-rate-guaranteed contracts that will drive power rates up a further 40 per cent to 50 per cent in coming years. Adding salt to this self-inflicted wound is the reality that much of the green power comes on stream when it isn’t needed. This unneeded electricity is dumped into the United States at bargain-basement prices that Ontario’s Auditor-General found has already cost Ontario power consumers billions of dollars, with much bigger losses yet to come before those 20-year contracts expire.
Given these disastrous results, one would think that Ms. Wynne and her cabinet colleagues would have carefully studied experience in other jurisdictions before implementing green policy two. The first and largest carbon cap-and-trade scheme is Europe’s 10-year-old system. As in Ontario, the story begins with huge subsidies for wind and solar power that drove up electricity prices precipitously. Cap-and-trade handed wind and solar power companies a second windfall by creating a “carbon trading market” that allowed them to sell “carbon offsets” from their low-emission projects.
On the other hand, many factories and industrial plants, already struggling with high power costs, found it more profitable to shut down and sell their carbon credit allocation in the carbon trading market. As a result, the bulk of Europe’s emissions reductions have been achieved by the departure of energy-intensive industries to overseas locations. Many of the products consumed by Europeans are now produced in countries without emissions limits, demonstrating the futility of imposing local carbon cap measures without global commitments. And since European industry was already among the world’s most energy efficient, the emissions embedded in most of those imported goods are higher than when the same goods were produced domestically.
Adding irony to this job-exporting fiasco, some European countries, including Germany, have implemented subsidies in an effort to keep the remnants of their industrial sector from shutting down. German electricity consumers paid some €20-billion ($27.2-billion) in green power subsidies last year, while at the same time their government spent billions of euros to help industrial plants survive the combination of high electricity and cap-and-trade costs that made them uncompetitive in the first place.
The Ontario announcement has promulgated a debate as to whether cap-and-trade is a tax. Clearly, for those having to buy carbon credits, it amounts to a tax. But for those who have credits to sell, it amounts to a subsidy.
But what most commenters have missed is that former premier Dalton McGuinty’s Green Energy Act created what is, for practical purposes, an indirect tax on energy consumers. Now comes Ms. Wynne’s equally ill-considered cap-and-trade tax. In mirror image to Europe’s green-power-driven levy on electricity consumers followed by cap-and-trade, Ontario’s ill-considered green scheme No. 2 could strike the final blow that drives industry elsewhere.
This leaves the question as to why Quebec so warmly welcomed Ontario’s decision to join its cap-and-trade system. Quebec’s electricity comes almost entirely from cheap, emissions-free hydropower, mitigating much of the competitive impact of cap-and-trade. Quebec has just announced a massive expansion of its hydropower capacity and is looking for markets. The net effect of signing Ontario onto its cap-and-trade system may well be the export of jobs from Ontario to Quebec businesses and the export of electricity from Quebec to Ontario consumers, along with the added bonus of selling carbon credits to Ontario businesses unable to meet cap-and-trade targets.
Ontario generates just 0.5 per cent of global carbon emissions. Even a giant 20-per-cent reduction would knock just a tenth of 1 per cent off global emissions. A minuscule gain for the globe, at a potentially enormous cost to the people of Ontario, and all Canadians.
Gwyn Morgan is a retired Canadian business leader who has been a director of five global corporations

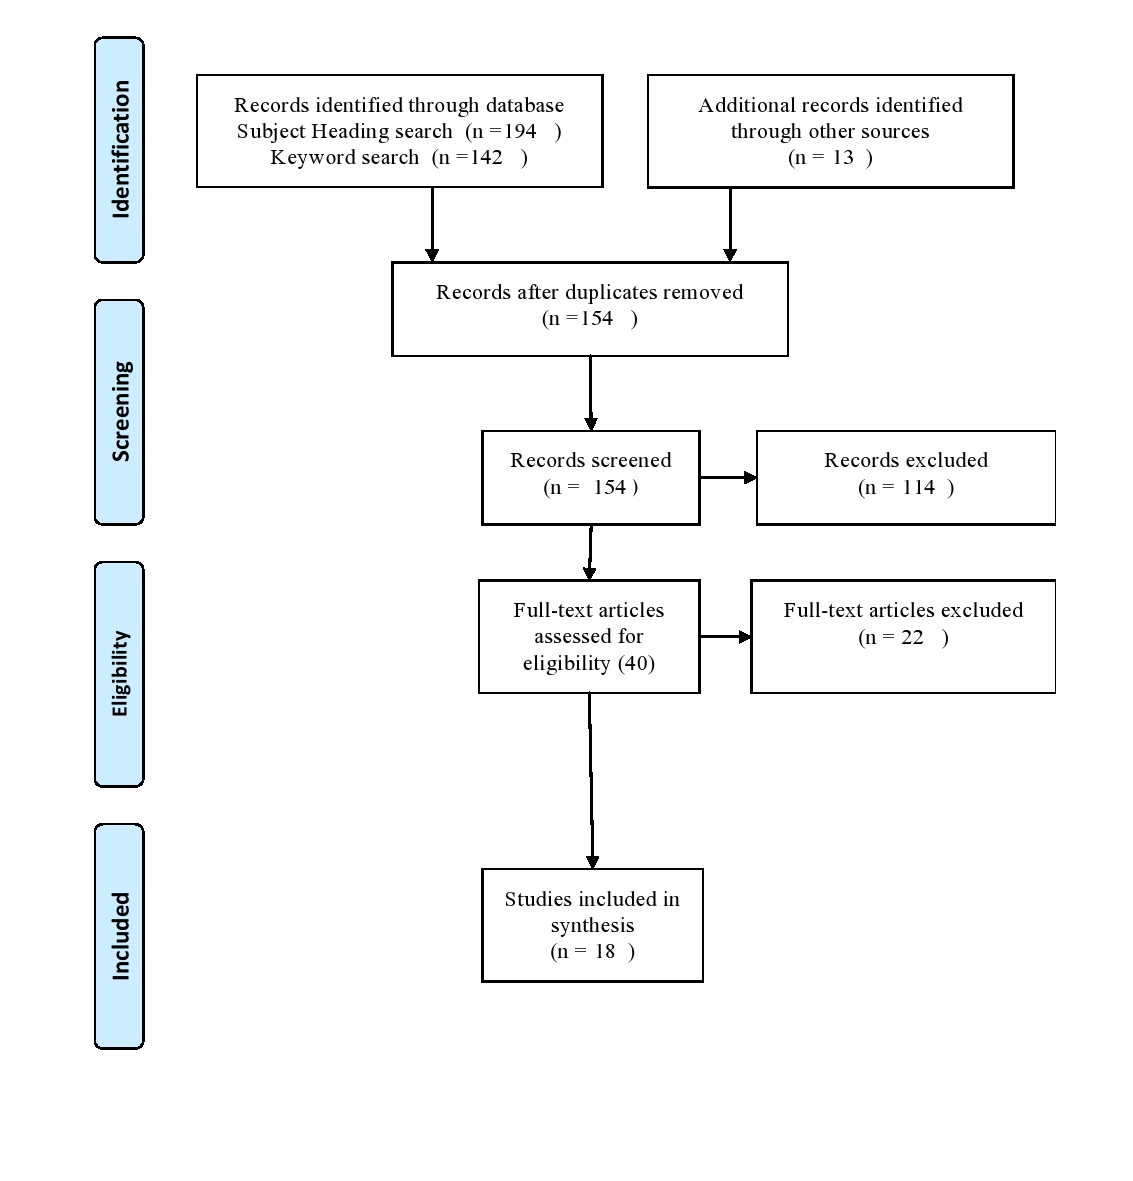